| Red | Green | Blue | |
| z | 17.64 | ||
| znorm | Inf | ||
| sky | -Inf | -Inf | -Inf |
| S/N | 34.0 | 59.6 | 62.5 |
| S/N(c) | 0.0 | 0.0 | 0.0 |
| SN(E/C) |
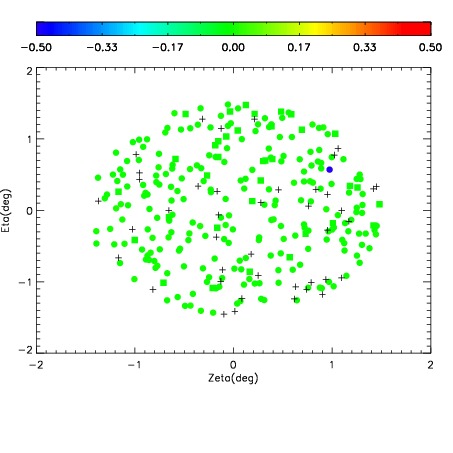
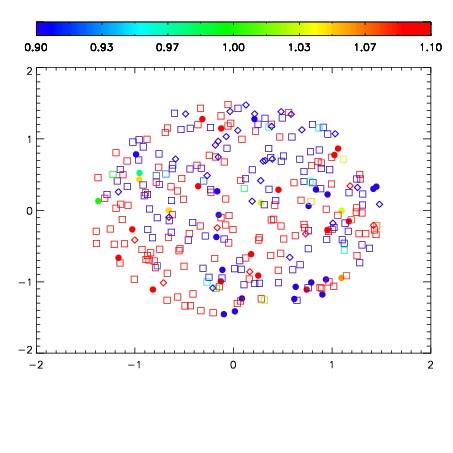
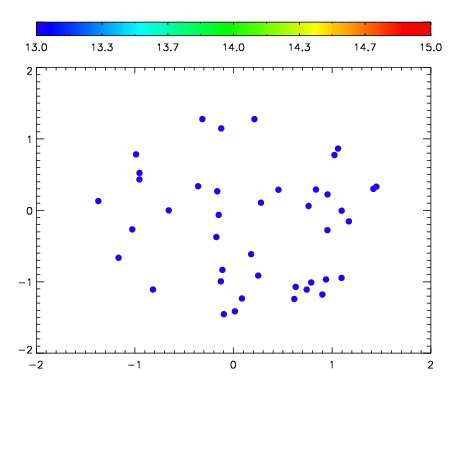

| Frame | Nreads | Zeropoints | Mag plots | Spatial mag deviation | Spatial sky 16325A emission deviations (filled: sky, open: star) | Spatial sky continuum emission | Spatial sky telluric CO2 absorption deviations (filled: H < 10) | |||||||||||||||||||||||
| 0 | 0 |
|
|
|
|
|
|
| IPAIR | NAME | SHIFT | NEWSHIFT | S/N | NAME | SHIFT | NEWSHIFT | S/N |
| 0 | 03710031 | 0.501952 | 0.00000 | 19.1659 | 03710028 | 0.00129678 | 0.500655 | 19.1460 |
| 1 | 03710030 | 0.496540 | 0.00541198 | 19.1690 | 03710033 | -0.000677432 | 0.502629 | 19.1538 |
| 2 | 03710027 | 0.500031 | 0.00192100 | 19.1685 | 03710029 | 0.000290297 | 0.501662 | 19.1488 |
| 3 | 03710034 | 0.497370 | 0.00458199 | 19.1565 | 03710032 | 0.000492679 | 0.501459 | 19.1433 |
| 4 | 03710035 | 0.500549 | 0.00140297 | 19.1390 | 03710036 | 0.00310551 | 0.498846 | 19.1259 |
| 5 | 03710026 | 0.495818 | 0.00613400 | 19.1262 | 03710025 | 0.00000 | 0.501952 | 19.0207 |