| Red | Green | Blue | |
| z | 17.64 | ||
| znorm | Inf | ||
| sky | -Inf | -Inf | -Inf |
| S/N | 16.2 | 30.6 | 32.5 |
| S/N(c) | 0.0 | 0.0 | 0.0 |
| SN(E/C) |

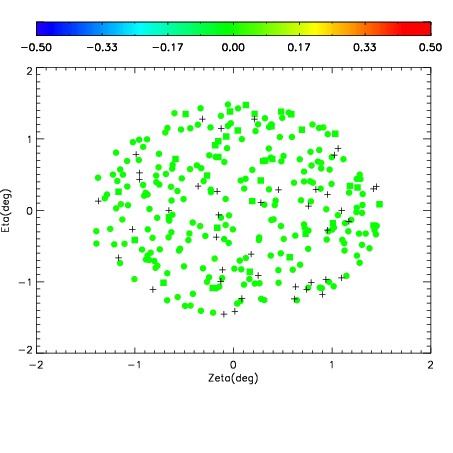
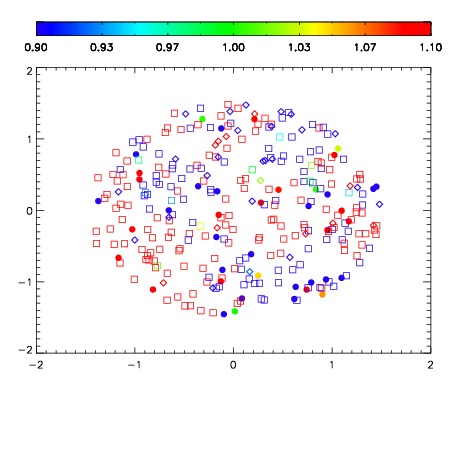


| Frame | Nreads | Zeropoints | Mag plots | Spatial mag deviation | Spatial sky 16325A emission deviations (filled: sky, open: star) | Spatial sky continuum emission | Spatial sky telluric CO2 absorption deviations (filled: H < 10) | |||||||||||||||||||||||
| 0 | 0 |
|
|
|
|
|
|
| IPAIR | NAME | SHIFT | NEWSHIFT | S/N | NAME | SHIFT | NEWSHIFT | S/N |
| 0 | 03760031 | 0.509476 | 0.00000 | 18.2193 | 03760032 | 0.00169123 | 0.507785 | 17.8372 |
| 1 | 03760035 | 0.509242 | 0.000234008 | 18.7812 | 03760036 | -0.000127580 | 0.509604 | 18.8286 |
| 2 | 03760030 | 0.507112 | 0.00236398 | 18.5350 | 03760029 | 0.00000 | 0.509476 | 18.7770 |
| 3 | 03760034 | 0.507540 | 0.00193602 | 18.4401 | 03760033 | 0.000793353 | 0.508683 | 17.8826 |