| Red | Green | Blue | |
| z | 17.64 | ||
| znorm | Inf | ||
| sky | -Inf | -Inf | -Inf |
| S/N | 19.4 | 32.5 | 34.7 |
| S/N(c) | 0.0 | 0.0 | 0.0 |
| SN(E/C) |
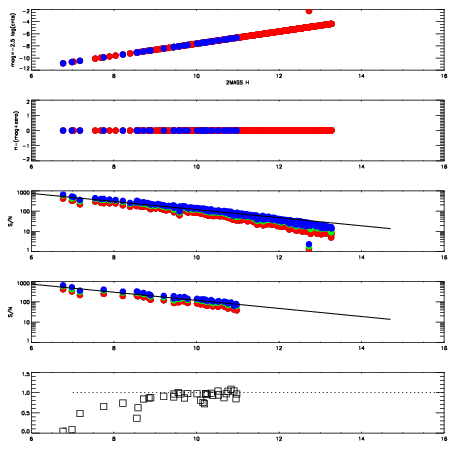

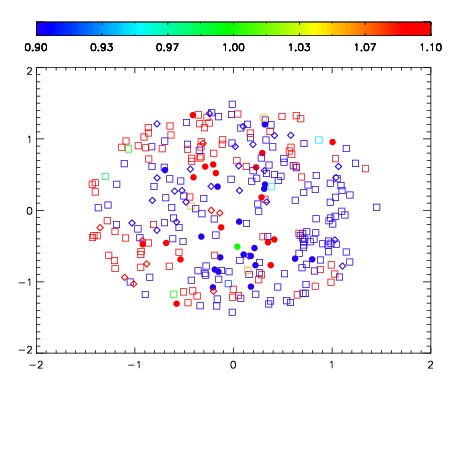
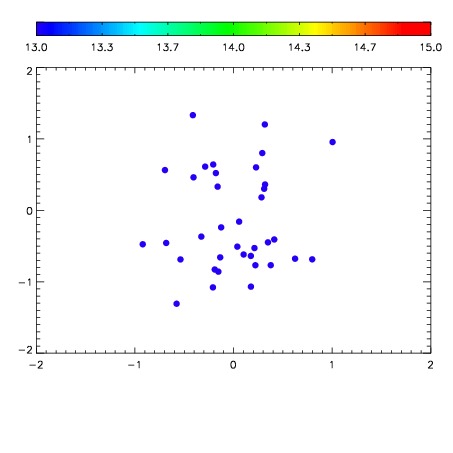

| Frame | Nreads | Zeropoints | Mag plots | Spatial mag deviation | Spatial sky 16325A emission deviations (filled: sky, open: star) | Spatial sky continuum emission | Spatial sky telluric CO2 absorption deviations (filled: H < 10) | |||||||||||||||||||||||
| 0 | 0 |
|
|
|
|
|
|
| IPAIR | NAME | SHIFT | NEWSHIFT | S/N | NAME | SHIFT | NEWSHIFT | S/N |
| 0 | 03420042 | 0.498439 | 0.00000 | 18.7051 | 03420036 | 0.00000 | 0.498439 | 18.6857 |
| 1 | 03420037 | 0.492363 | 0.00607601 | 18.8438 | 03420039 | 0.00175828 | 0.496681 | 18.8979 |
| 2 | 03420038 | 0.494115 | 0.00432402 | 18.8100 | 03420040 | 5.22028e-05 | 0.498387 | 18.8279 |
| 3 | 03420041 | 0.495346 | 0.00309300 | 18.7962 | 03420043 | 0.00177302 | 0.496666 | 18.8179 |