| Red | Green | Blue | |
| z | 17.64 | ||
| znorm | Inf | ||
| sky | -NaN | -NaN | -Inf |
| S/N | 32.7 | 55.4 | 61.0 |
| S/N(c) | 0.0 | 0.0 | 0.0 |
| SN(E/C) |
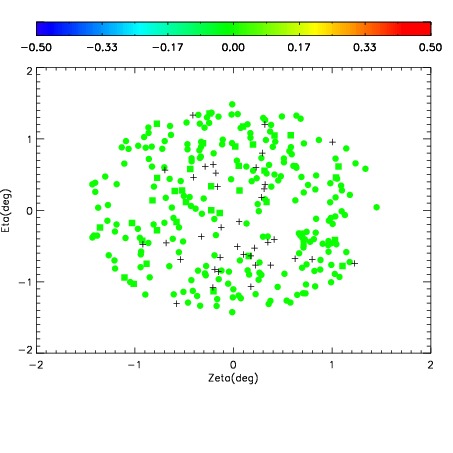
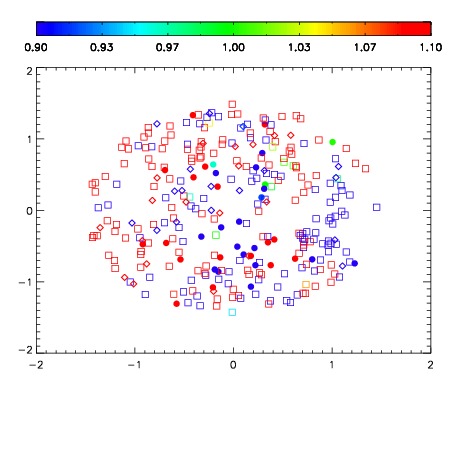


| Frame | Nreads | Zeropoints | Mag plots | Spatial mag deviation | Spatial sky 16325A emission deviations (filled: sky, open: star) | Spatial sky continuum emission | Spatial sky telluric CO2 absorption deviations (filled: H < 10) | |||||||||||||||||||||||
| 0 | 0 |
|
|
|
|
|
|
| IPAIR | NAME | SHIFT | NEWSHIFT | S/N | NAME | SHIFT | NEWSHIFT | S/N |
| 0 | 03750042 | 0.515750 | 0.00000 | 19.0488 | 03750047 | 0.00670103 | 0.509049 | 19.0587 |
| 1 | 03750050 | 0.512899 | 0.00285101 | 19.1985 | 03750051 | 0.00591272 | 0.509837 | 19.1605 |
| 2 | 03750049 | 0.507074 | 0.00867599 | 19.1777 | 03750048 | 0.00444268 | 0.511307 | 19.0993 |
| 3 | 03750045 | 0.507623 | 0.00812697 | 19.0499 | 03750043 | 0.00212060 | 0.513629 | 19.0643 |
| 4 | 03750046 | 0.510260 | 0.00549001 | 19.0257 | 03750044 | 0.00209426 | 0.513656 | 19.0542 |
| 5 | 03750041 | 0.507459 | 0.00829101 | 18.9764 | 03750040 | 0.00000 | 0.515750 | 19.0014 |