| Red | Green | Blue | |
| z | 17.64 | ||
| znorm | Inf | ||
| sky | -NaN | -NaN | -Inf |
| S/N | 27.8 | 46.8 | 51.1 |
| S/N(c) | 0.0 | 0.0 | 0.0 |
| SN(E/C) |
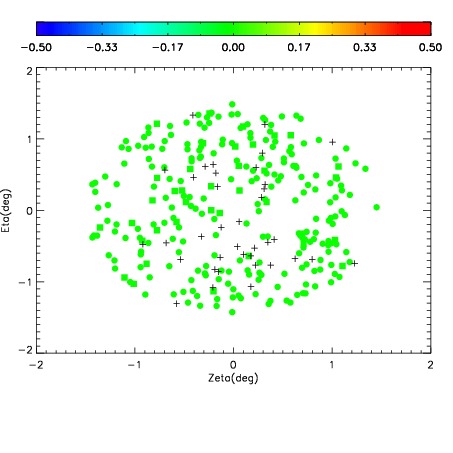


| Frame | Nreads | Zeropoints | Mag plots | Spatial mag deviation | Spatial sky 16325A emission deviations (filled: sky, open: star) | Spatial sky continuum emission | Spatial sky telluric CO2 absorption deviations (filled: H < 10) | |||||||||||||||||||||||
| 0 | 0 |
|
|
|
|
|
|
| IPAIR | NAME | SHIFT | NEWSHIFT | S/N | NAME | SHIFT | NEWSHIFT | S/N |
| 0 | 03950029 | 0.498631 | 0.00000 | 19.1111 | 03950030 | -0.000255842 | 0.498887 | 19.0736 |
| 1 | 03950032 | 0.497183 | 0.00144801 | 19.1501 | 03950031 | -0.00307917 | 0.501710 | 19.1326 |
| 2 | 03950028 | 0.497797 | 0.000833988 | 19.1387 | 03950027 | 0.00000 | 0.498631 | 19.1244 |
| 3 | 03950033 | 0.497718 | 0.000912994 | 19.1195 | 03950034 | -0.00208303 | 0.500714 | 19.0966 |