| Red | Green | Blue | |
| z | 17.64 | ||
| znorm | Inf | ||
| sky | -Inf | -Inf | -Inf |
| S/N | 25.7 | 44.8 | 45.2 |
| S/N(c) | 0.0 | 0.0 | 0.0 |
| SN(E/C) |
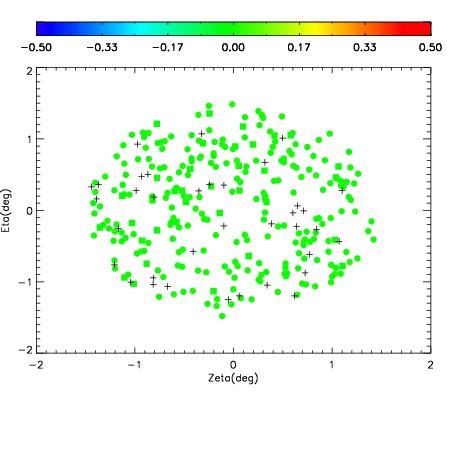
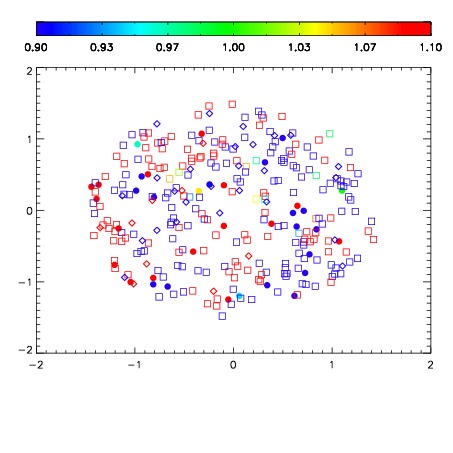


| Frame | Nreads | Zeropoints | Mag plots | Spatial mag deviation | Spatial sky 16325A emission deviations (filled: sky, open: star) | Spatial sky continuum emission | Spatial sky telluric CO2 absorption deviations (filled: H < 10) | |||||||||||||||||||||||
| 0 | 0 |
|
|
|
|
|
|
| IPAIR | NAME | SHIFT | NEWSHIFT | S/N | NAME | SHIFT | NEWSHIFT | S/N |
| 0 | 03760046 | 0.509474 | 0.00000 | 18.5770 | 03760043 | 0.00247598 | 0.506998 | 18.7770 |
| 1 | 03760045 | 0.507487 | 0.00198698 | 19.0404 | 03760047 | 0.000601830 | 0.508872 | 19.0041 |
| 2 | 03760041 | 0.505843 | 0.00363100 | 19.0101 | 03760044 | 0.00149029 | 0.507984 | 19.0009 |
| 3 | 03760042 | 0.507179 | 0.00229496 | 19.0053 | 03760040 | 0.00000 | 0.509474 | 18.9379 |