| Red | Green | Blue | |
| z | 17.64 | ||
| znorm | Inf | ||
| sky | -Inf | -Inf | -Inf |
| S/N | 20.4 | 36.1 | 37.5 |
| S/N(c) | 0.0 | 0.0 | 0.0 |
| SN(E/C) |

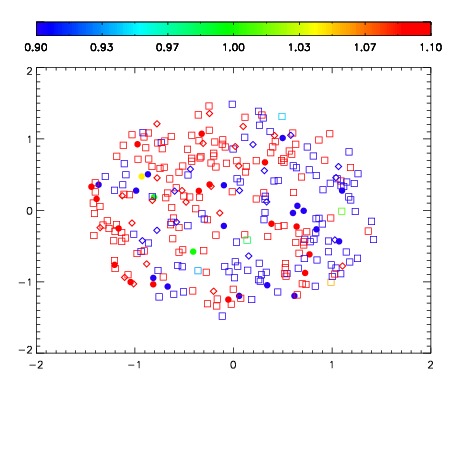


| Frame | Nreads | Zeropoints | Mag plots | Spatial mag deviation | Spatial sky 16325A emission deviations (filled: sky, open: star) | Spatial sky continuum emission | Spatial sky telluric CO2 absorption deviations (filled: H < 10) | |||||||||||||||||||||||
| 0 | 0 |
|
|
|
|
|
|
| IPAIR | NAME | SHIFT | NEWSHIFT | S/N | NAME | SHIFT | NEWSHIFT | S/N |
| 0 | 03960027 | 0.495213 | 0.00000 | 18.9273 | 03960028 | 0.00907585 | 0.486137 | 19.1085 |
| 1 | 03960023 | 0.495018 | 0.000194997 | 18.6471 | 03960021 | 0.00000 | 0.495213 | 18.8944 |
| 2 | 03960022 | 0.494969 | 0.000243992 | 18.2902 | 03960024 | 0.00314535 | 0.492068 | 18.6111 |
| 3 | 03960026 | 0.494946 | 0.000266999 | 18.1364 | 03960025 | 0.0139116 | 0.481301 | 18.2220 |