| Red | Green | Blue | |
| z | 17.64 | ||
| znorm | Inf | ||
| sky | -Inf | -NaN | -NaN |
| S/N | 24.7 | 43.0 | 47.9 |
| S/N(c) | 0.0 | 0.0 | 0.0 |
| SN(E/C) |
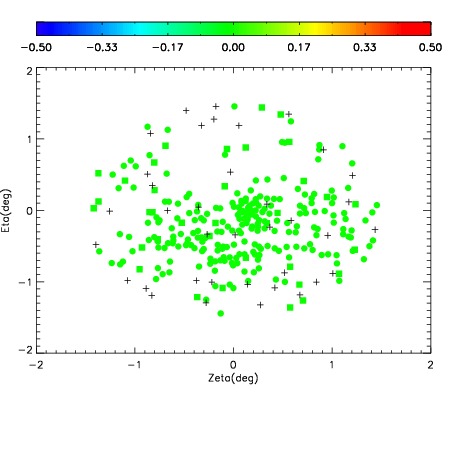
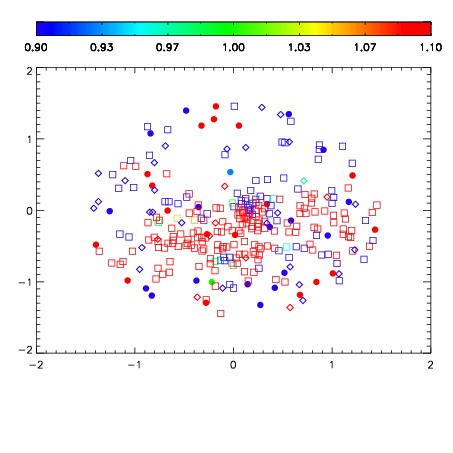
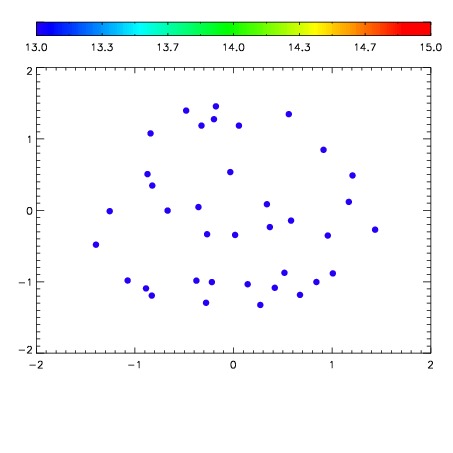

| Frame | Nreads | Zeropoints | Mag plots | Spatial mag deviation | Spatial sky 16325A emission deviations (filled: sky, open: star) | Spatial sky continuum emission | Spatial sky telluric CO2 absorption deviations (filled: H < 10) | |||||||||||||||||||||||
| 0 | 0 |
|
|
|
|
|
|
| IPAIR | NAME | SHIFT | NEWSHIFT | S/N | NAME | SHIFT | NEWSHIFT | S/N |
| 0 | 02610034 | 0.419352 | 0.00000 | 18.2894 | 02610035 | -0.00324381 | 0.422596 | 17.7031 |
| 1 | 02610029 | 0.414222 | 0.00512999 | 19.1174 | 02610031 | -0.00145773 | 0.420810 | 19.2248 |
| 2 | 02610030 | 0.416995 | 0.00235701 | 19.0961 | 02610032 | -0.00276598 | 0.422118 | 19.1014 |
| 3 | 02610033 | 0.416173 | 0.00317898 | 19.0722 | 02610028 | 0.00000 | 0.419352 | 18.9721 |