| Red | Green | Blue | |
| z | 17.64 | ||
| znorm | Inf | ||
| sky | -NaN | -Inf | -Inf |
| S/N | 29.1 | 49.4 | 55.2 |
| S/N(c) | 0.0 | 0.0 | 0.0 |
| SN(E/C) |
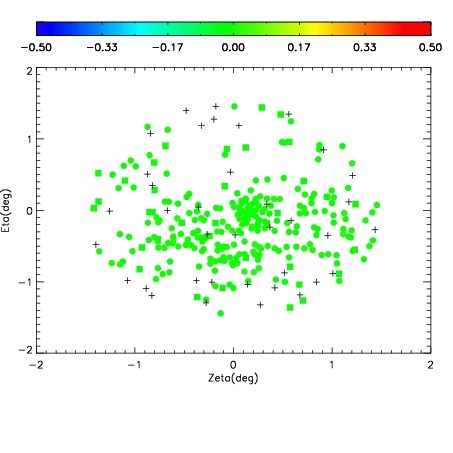
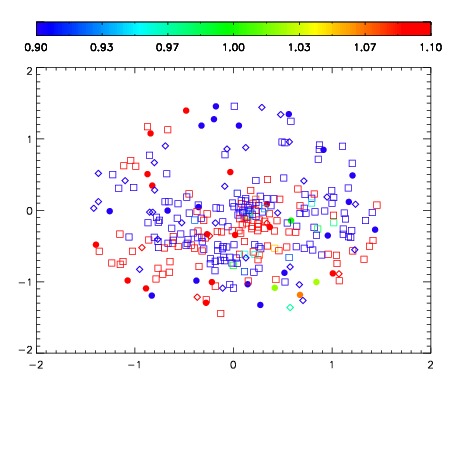
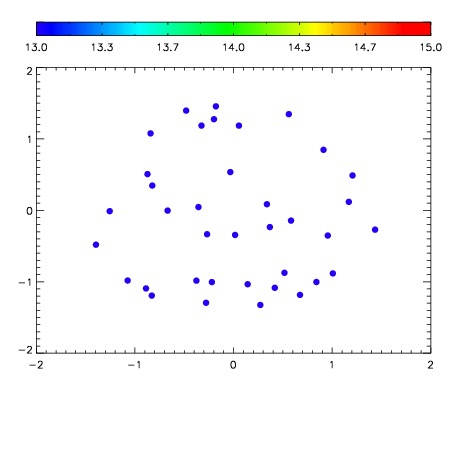

| Frame | Nreads | Zeropoints | Mag plots | Spatial mag deviation | Spatial sky 16325A emission deviations (filled: sky, open: star) | Spatial sky continuum emission | Spatial sky telluric CO2 absorption deviations (filled: H < 10) | |||||||||||||||||||||||
| 0 | 0 |
|
|
|
|
|
|
| IPAIR | NAME | SHIFT | NEWSHIFT | S/N | NAME | SHIFT | NEWSHIFT | S/N |
| 0 | 02830025 | 0.414106 | 0.00000 | 19.2648 | 02830026 | 0.00293385 | 0.411172 | 19.2576 |
| 1 | 02830024 | 0.413205 | 0.000901014 | 19.2710 | 02830023 | -0.00203125 | 0.416137 | 19.2637 |
| 2 | 02830020 | 0.412935 | 0.00117102 | 19.2641 | 02830022 | 0.00104314 | 0.413063 | 19.2512 |
| 3 | 02830021 | 0.413321 | 0.000785023 | 19.2601 | 02830019 | 0.00000 | 0.414106 | 19.2354 |