| Red | Green | Blue | |
| z | 17.64 | ||
| znorm | Inf | ||
| sky | -Inf | -Inf | -NaN |
| S/N | 29.1 | 48.9 | 54.0 |
| S/N(c) | 0.0 | 0.0 | 0.0 |
| SN(E/C) |

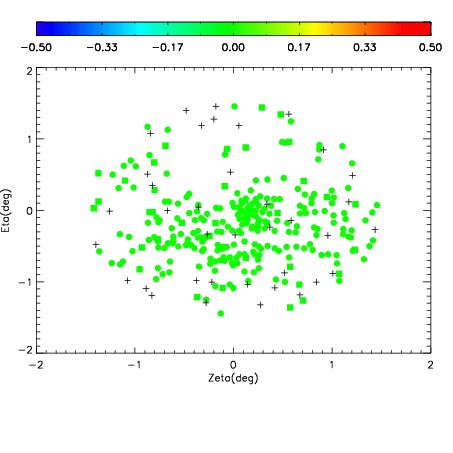
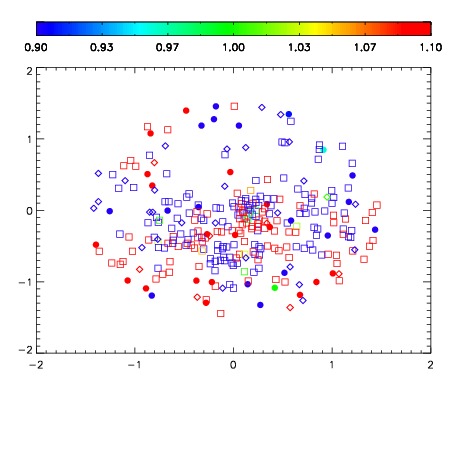
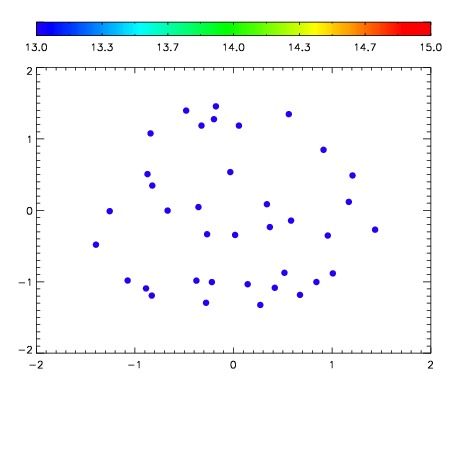

| Frame | Nreads | Zeropoints | Mag plots | Spatial mag deviation | Spatial sky 16325A emission deviations (filled: sky, open: star) | Spatial sky continuum emission | Spatial sky telluric CO2 absorption deviations (filled: H < 10) | |||||||||||||||||||||||
| 0 | 0 |
|
|
|
|
|
|
| IPAIR | NAME | SHIFT | NEWSHIFT | S/N | NAME | SHIFT | NEWSHIFT | S/N |
| 0 | 02860029 | 0.416512 | 0.00000 | 19.2123 | 02860027 | 0.00000 | 0.416512 | 19.2144 |
| 1 | 02860032 | 0.414663 | 0.00184903 | 19.2359 | 02860031 | 0.000407354 | 0.416105 | 19.2471 |
| 2 | 02860028 | 0.415420 | 0.00109202 | 19.2269 | 02860030 | 0.00458052 | 0.411931 | 19.2273 |
| 3 | 02860033 | 0.416432 | 8.00192e-05 | 19.2158 | 02860034 | 0.00534018 | 0.411172 | 19.2162 |