| Red | Green | Blue | |
| z | 17.64 | ||
| znorm | Inf | ||
| sky | -NaN | -NaN | -Inf |
| S/N | 26.6 | 47.0 | 48.9 |
| S/N(c) | 0.0 | 0.0 | 0.0 |
| SN(E/C) |
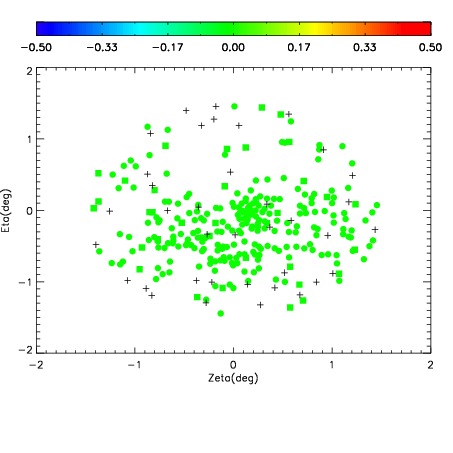
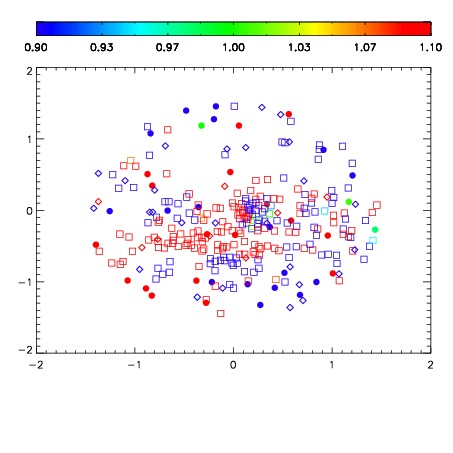


| Frame | Nreads | Zeropoints | Mag plots | Spatial mag deviation | Spatial sky 16325A emission deviations (filled: sky, open: star) | Spatial sky continuum emission | Spatial sky telluric CO2 absorption deviations (filled: H < 10) | |||||||||||||||||||||||
| 0 | 0 |
|
|
|
|
|
|
| IPAIR | NAME | SHIFT | NEWSHIFT | S/N | NAME | SHIFT | NEWSHIFT | S/N |
| 0 | 02880014 | 0.414805 | 0.00000 | 19.2228 | 02880012 | 0.00000 | 0.414805 | 19.2385 |
| 1 | 02880013 | 0.413949 | 0.000855982 | 19.1968 | 02880019 | 0.00130562 | 0.413499 | 19.2042 |
| 2 | 02880018 | 0.412497 | 0.00230798 | 19.1716 | 02880015 | 0.00104557 | 0.413759 | 19.1478 |
| 3 | 02880017 | 0.411627 | 0.00317800 | 19.1600 | 02880016 | 0.000756155 | 0.414049 | 19.1476 |