| Red | Green | Blue | |
| z | 17.64 | ||
| znorm | Inf | ||
| sky | -Inf | -Inf | -Inf |
| S/N | 15.9 | 30.7 | 30.4 |
| S/N(c) | 0.0 | 0.0 | 0.0 |
| SN(E/C) |
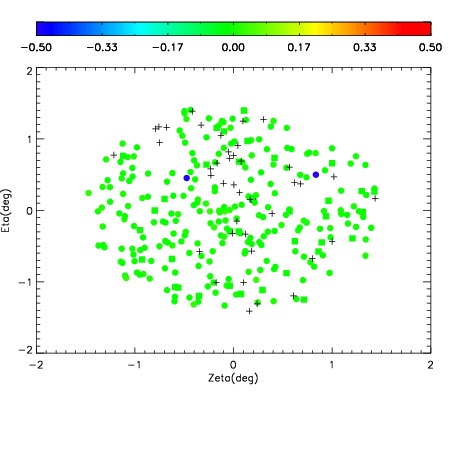
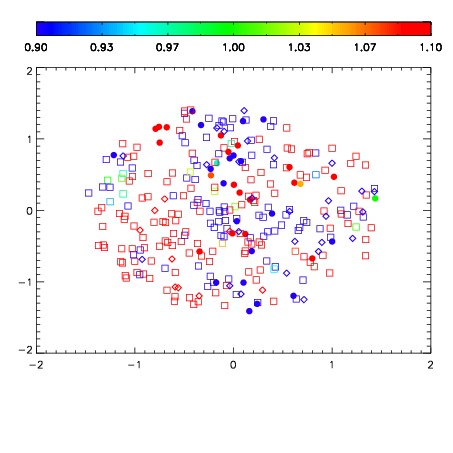


| Frame | Nreads | Zeropoints | Mag plots | Spatial mag deviation | Spatial sky 16325A emission deviations (filled: sky, open: star) | Spatial sky continuum emission | Spatial sky telluric CO2 absorption deviations (filled: H < 10) | |||||||||||||||||||||||
| 0 | 0 |
|
|
|
|
|
|
| IPAIR | NAME | SHIFT | NEWSHIFT | S/N | NAME | SHIFT | NEWSHIFT | S/N |
| 0 | 02540050 | 0.401060 | 0.00000 | 18.5881 | 02540051 | -0.00148989 | 0.402550 | 18.8334 |
| 1 | 02540049 | 0.400814 | 0.000245988 | 18.5570 | 02540048 | 0.00000 | 0.401060 | 18.7028 |
| 2 | 02540054 | 0.400980 | 7.99894e-05 | 18.4952 | 02540055 | -0.00274061 | 0.403801 | 18.3868 |
| 3 | 02540053 | 0.400660 | 0.000399977 | 18.4594 | 02540052 | -0.00465317 | 0.405713 | 18.2668 |