| Red | Green | Blue | |
| z | 17.64 | ||
| znorm | Inf | ||
| sky | -Inf | -Inf | -Inf |
| S/N | 17.7 | 31.3 | 37.3 |
| S/N(c) | 0.0 | 0.0 | 0.0 |
| SN(E/C) |
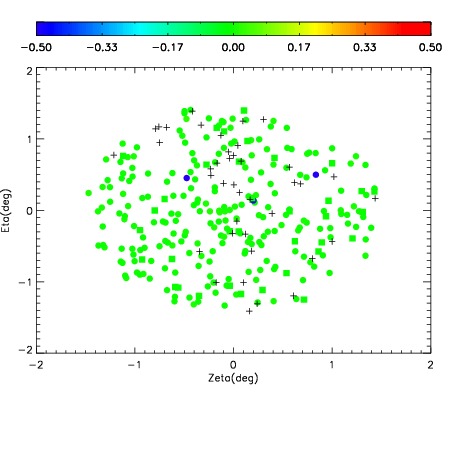


| Frame | Nreads | Zeropoints | Mag plots | Spatial mag deviation | Spatial sky 16325A emission deviations (filled: sky, open: star) | Spatial sky continuum emission | Spatial sky telluric CO2 absorption deviations (filled: H < 10) | |||||||||||||||||||||||
| 0 | 0 |
|
|
|
|
|
|
| IPAIR | NAME | SHIFT | NEWSHIFT | S/N | NAME | SHIFT | NEWSHIFT | S/N |
| 0 | 02810029 | 0.415115 | 0.00000 | 18.5342 | 02810030 | -0.000106241 | 0.415221 | 18.5182 |
| 1 | 02810032 | 0.413341 | 0.00177401 | 18.6705 | 02810027 | 0.00000 | 0.415115 | 18.6446 |
| 2 | 02810033 | 0.413982 | 0.00113299 | 18.6352 | 02810031 | -0.00372928 | 0.418844 | 18.5755 |
| 3 | 02810028 | 0.410943 | 0.00417200 | 18.4858 | 02810034 | -0.00237467 | 0.417490 | 18.5169 |