| Red | Green | Blue | |
| z | 17.64 | ||
| znorm | Inf | ||
| sky | -Inf | -Inf | -Inf |
| S/N | 25.1 | 46.8 | 50.7 |
| S/N(c) | 0.0 | 0.0 | 0.0 |
| SN(E/C) |
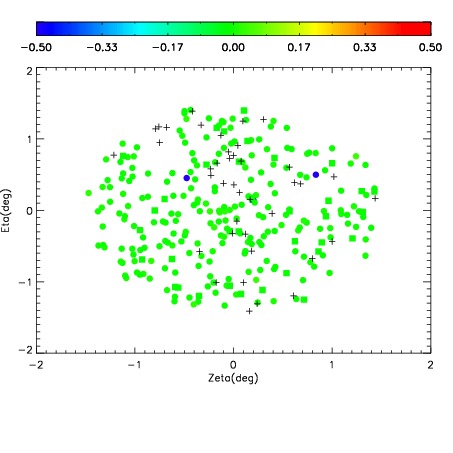
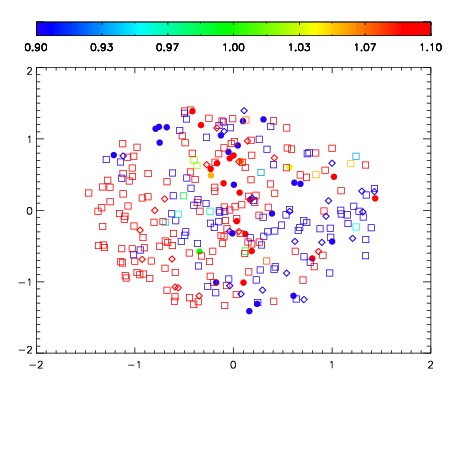


| Frame | Nreads | Zeropoints | Mag plots | Spatial mag deviation | Spatial sky 16325A emission deviations (filled: sky, open: star) | Spatial sky continuum emission | Spatial sky telluric CO2 absorption deviations (filled: H < 10) | |||||||||||||||||||||||
| 0 | 0 |
|
|
|
|
|
|
| IPAIR | NAME | SHIFT | NEWSHIFT | S/N | NAME | SHIFT | NEWSHIFT | S/N |
| 0 | 03120057 | 0.499377 | 0.00000 | 19.0702 | 03120055 | -0.00176544 | 0.501142 | 19.0722 |
| 1 | 03120052 | 0.492740 | 0.00663701 | 19.0851 | 03120054 | 0.00259432 | 0.496783 | 19.1232 |
| 2 | 03120056 | 0.499151 | 0.000226021 | 19.0360 | 03120051 | 0.000459597 | 0.498917 | 19.0646 |
| 3 | 03120048 | 0.495792 | 0.00358501 | 19.0247 | 03120050 | 0.00220043 | 0.497177 | 19.0442 |
| 4 | 03120053 | 0.493175 | 0.00620201 | 18.9851 | 03120058 | -0.000167355 | 0.499544 | 19.0350 |
| 5 | 03120049 | 0.496728 | 0.00264901 | 18.8260 | 03120047 | 0.00000 | 0.499377 | 18.9601 |