| Red | Green | Blue | |
| z | 17.64 | ||
| znorm | Inf | ||
| sky | -Inf | -Inf | -Inf |
| S/N | 23.6 | 42.4 | 44.3 |
| S/N(c) | 0.0 | 0.0 | 0.0 |
| SN(E/C) |
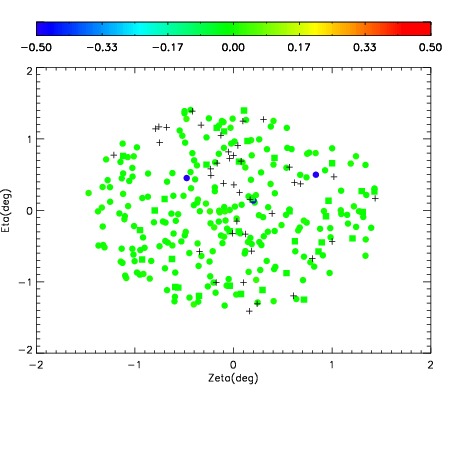
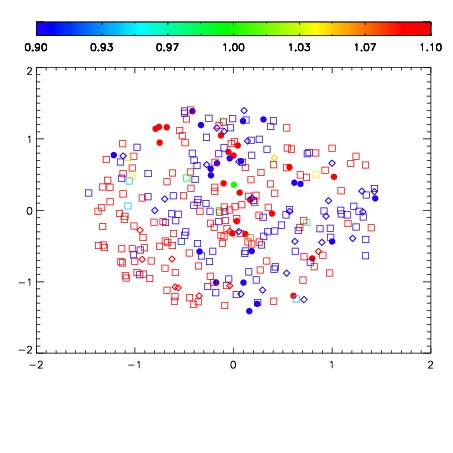
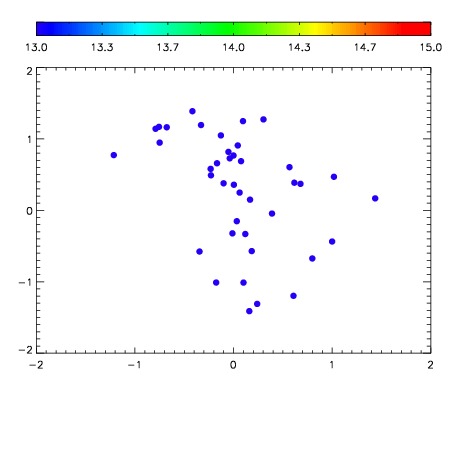

| Frame | Nreads | Zeropoints | Mag plots | Spatial mag deviation | Spatial sky 16325A emission deviations (filled: sky, open: star) | Spatial sky continuum emission | Spatial sky telluric CO2 absorption deviations (filled: H < 10) | |||||||||||||||||||||||
| 0 | 0 |
|
|
|
|
|
|
| IPAIR | NAME | SHIFT | NEWSHIFT | S/N | NAME | SHIFT | NEWSHIFT | S/N |
| 0 | 03430036 | 0.506294 | 0.00000 | 19.0984 | 03430037 | 0.00124473 | 0.505049 | 19.0767 |
| 1 | 03430040 | 0.504873 | 0.00142103 | 19.1341 | 03430041 | 0.000393656 | 0.505900 | 19.1546 |
| 2 | 03430039 | 0.504216 | 0.00207800 | 19.1077 | 03430038 | 0.000256378 | 0.506038 | 19.0970 |
| 3 | 03430035 | 0.505039 | 0.00125504 | 19.1054 | 03430034 | 0.00000 | 0.506294 | 19.0928 |