| Red | Green | Blue | |
| z | 17.64 | ||
| znorm | Inf | ||
| sky | -Inf | -Inf | -Inf |
| S/N | 10.1 | 21.1 | 22.2 |
| S/N(c) | 0.0 | 0.0 | 0.0 |
| SN(E/C) |
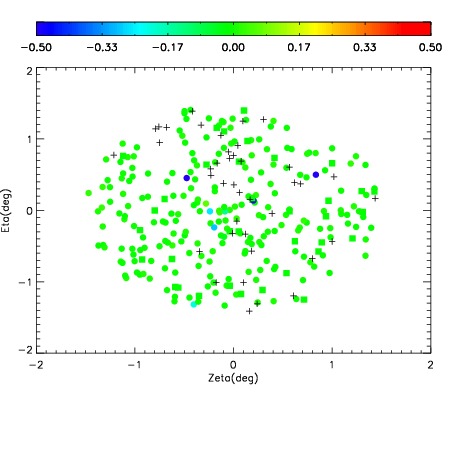
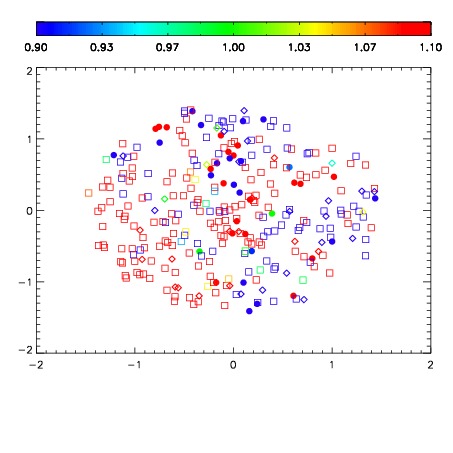
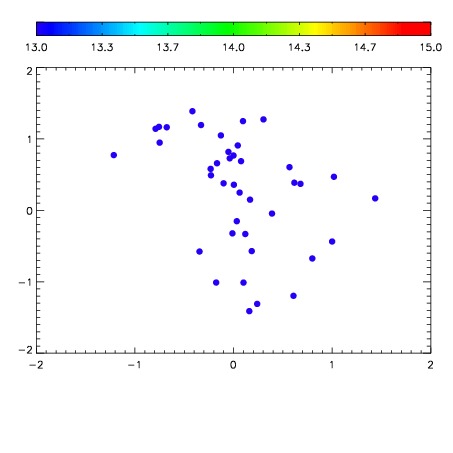

| Frame | Nreads | Zeropoints | Mag plots | Spatial mag deviation | Spatial sky 16325A emission deviations (filled: sky, open: star) | Spatial sky continuum emission | Spatial sky telluric CO2 absorption deviations (filled: H < 10) | |||||||||||||||||||||||
| 0 | 0 |
|
|
|
|
|
|
| IPAIR | NAME | SHIFT | NEWSHIFT | S/N | NAME | SHIFT | NEWSHIFT | S/N |
| 0 | 03440036 | 0.504525 | 0.00000 | 17.4447 | 03440037 | -0.000226272 | 0.504751 | 17.3219 |
| 1 | 03440032 | 0.503825 | 0.000699997 | 18.1083 | 03440030 | 0.00000 | 0.504525 | 18.1922 |
| 2 | 03440031 | 0.502705 | 0.00182003 | 18.0171 | 03440033 | 0.00131691 | 0.503208 | 17.8690 |
| 3 | 03440035 | 0.502344 | 0.00218099 | 17.5568 | 03440034 | -0.000148743 | 0.504674 | 17.8327 |