| Red | Green | Blue | |
| z | 17.64 | ||
| znorm | Inf | ||
| sky | -Inf | -Inf | -Inf |
| S/N | 22.8 | 40.1 | 43.4 |
| S/N(c) | 0.0 | 0.0 | 0.0 |
| SN(E/C) |
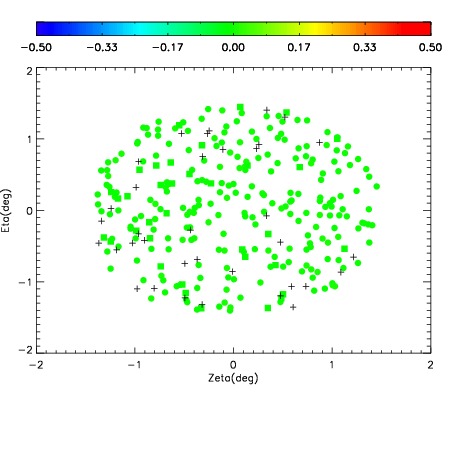
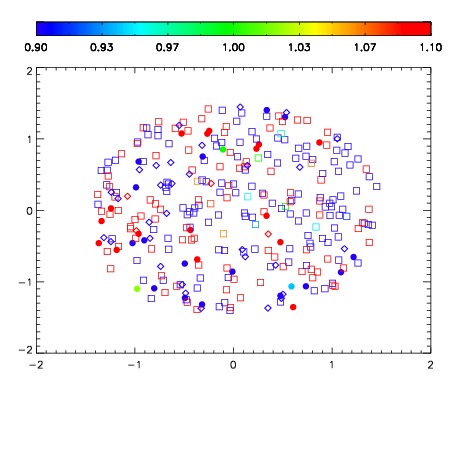
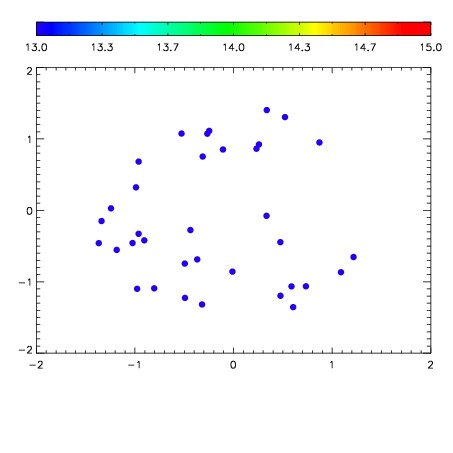

| Frame | Nreads | Zeropoints | Mag plots | Spatial mag deviation | Spatial sky 16325A emission deviations (filled: sky, open: star) | Spatial sky continuum emission | Spatial sky telluric CO2 absorption deviations (filled: H < 10) | |||||||||||||||||||||||
| 0 | 0 |
|
|
|
|
|
|
| IPAIR | NAME | SHIFT | NEWSHIFT | S/N | NAME | SHIFT | NEWSHIFT | S/N |
| 0 | 02870081 | 0.410872 | 0.00000 | 18.8826 | 02870078 | 0.00117150 | 0.409701 | 18.7560 |
| 1 | 02870077 | 0.410591 | 0.000281006 | 18.9404 | 02870075 | 0.00000 | 0.410872 | 18.9912 |
| 2 | 02870076 | 0.408888 | 0.00198400 | 18.9391 | 02870082 | -0.00137338 | 0.412245 | 18.9060 |
| 3 | 02870080 | 0.409869 | 0.00100303 | 18.6880 | 02870079 | -0.000554040 | 0.411426 | 18.7540 |