| Red | Green | Blue | |
| z | 17.64 | ||
| znorm | Inf | ||
| sky | -Inf | -Inf | -NaN |
| S/N | 30.2 | 51.3 | 52.1 |
| S/N(c) | 0.0 | 0.0 | 0.0 |
| SN(E/C) |
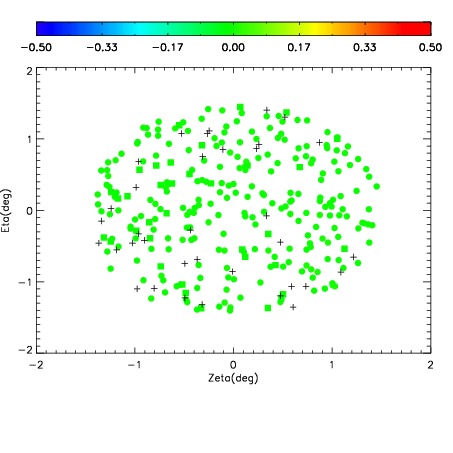
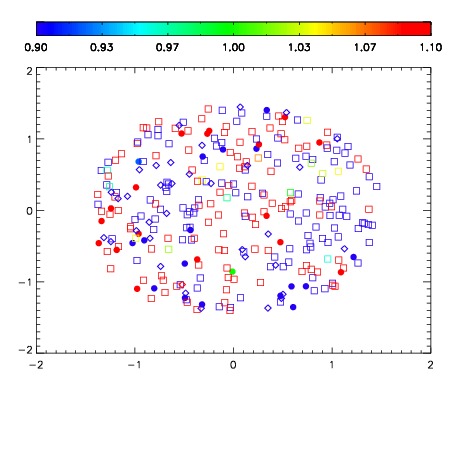
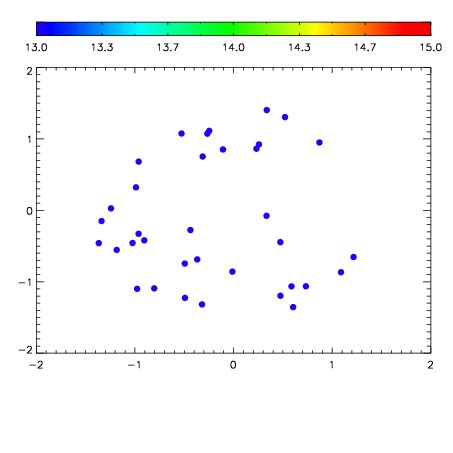

| Frame | Nreads | Zeropoints | Mag plots | Spatial mag deviation | Spatial sky 16325A emission deviations (filled: sky, open: star) | Spatial sky continuum emission | Spatial sky telluric CO2 absorption deviations (filled: H < 10) | |||||||||||||||||||||||
| 0 | 0 |
|
|
|
|
|
|
| IPAIR | NAME | SHIFT | NEWSHIFT | S/N | NAME | SHIFT | NEWSHIFT | S/N |
| 0 | 02910033 | 0.401970 | 0.00000 | 19.1979 | 02910030 | 0.000607647 | 0.401362 | 19.2185 |
| 1 | 02910029 | 0.398072 | 0.00389799 | 19.2282 | 02910031 | -0.000460471 | 0.402430 | 19.2208 |
| 2 | 02910028 | 0.397399 | 0.00457099 | 19.1956 | 02910027 | 0.00000 | 0.401970 | 19.1961 |
| 3 | 02910032 | 0.401171 | 0.000799000 | 19.1856 | 02910034 | 0.000376431 | 0.401594 | 19.1837 |