| Red | Green | Blue | |
| z | 17.64 | ||
| znorm | Inf | ||
| sky | -Inf | -Inf | -Inf |
| S/N | 17.2 | 29.7 | 34.4 |
| S/N(c) | 0.0 | 0.0 | 0.0 |
| SN(E/C) |
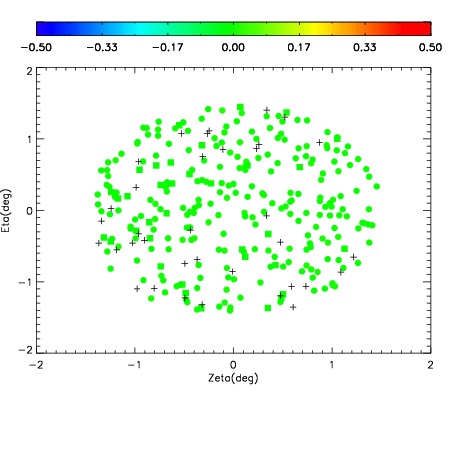
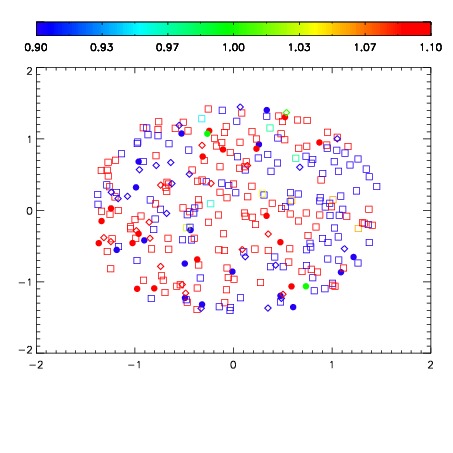
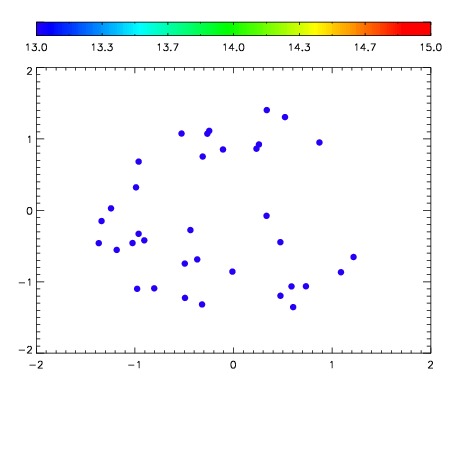

| Frame | Nreads | Zeropoints | Mag plots | Spatial mag deviation | Spatial sky 16325A emission deviations (filled: sky, open: star) | Spatial sky continuum emission | Spatial sky telluric CO2 absorption deviations (filled: H < 10) | |||||||||||||||||||||||
| 0 | 0 |
|
|
|
|
|
|
| IPAIR | NAME | SHIFT | NEWSHIFT | S/N | NAME | SHIFT | NEWSHIFT | S/N |
| 0 | 03140049 | 0.504366 | 0.00000 | 18.4850 | 03140050 | -7.14884e-05 | 0.504437 | 18.5028 |
| 1 | 03140048 | 0.501993 | 0.00237298 | 18.5583 | 03140051 | -0.00205256 | 0.506419 | 18.5295 |
| 2 | 03140052 | 0.497926 | 0.00643998 | 18.3043 | 03140047 | 0.00000 | 0.504366 | 18.3650 |
| 3 | 03140057 | 0.500405 | 0.00396097 | 18.2566 | 03140058 | -0.00453702 | 0.508903 | 17.9388 |
| 4 | 03140053 | 0.498954 | 0.00541198 | 18.1386 | 03140054 | -0.00257360 | 0.506940 | 17.8739 |
| 5 | 03140056 | 0.498925 | 0.00544098 | 17.9698 | 03140055 | -0.00455485 | 0.508921 | 17.8527 |