| Red | Green | Blue | |
| z | 17.64 | ||
| znorm | Inf | ||
| sky | -Inf | -Inf | -Inf |
| S/N | 28.1 | 49.2 | 52.2 |
| S/N(c) | 0.0 | 0.0 | 0.0 |
| SN(E/C) |
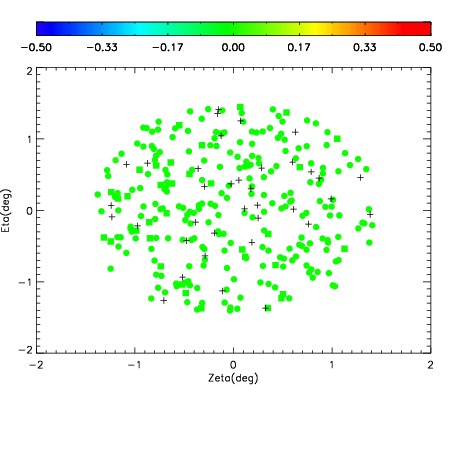
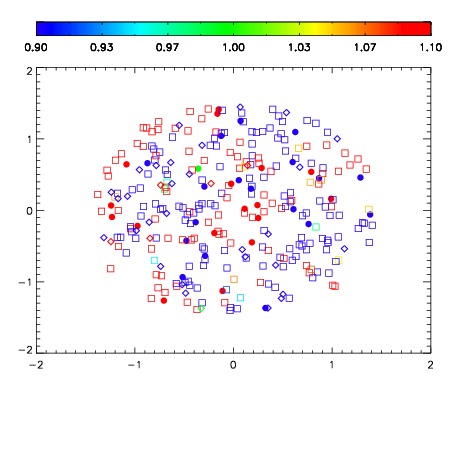
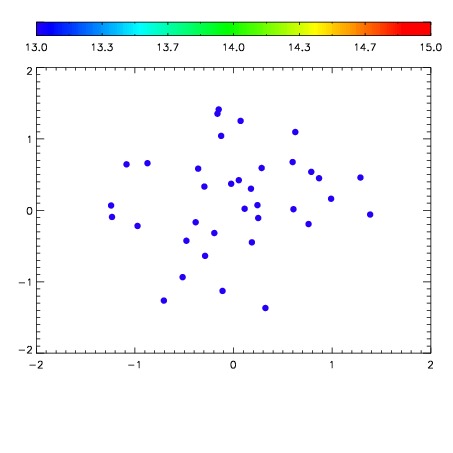

| Frame | Nreads | Zeropoints | Mag plots | Spatial mag deviation | Spatial sky 16325A emission deviations (filled: sky, open: star) | Spatial sky continuum emission | Spatial sky telluric CO2 absorption deviations (filled: H < 10) | |||||||||||||||||||||||
| 0 | 0 |
|
|
|
|
|
|
| IPAIR | NAME | SHIFT | NEWSHIFT | S/N | NAME | SHIFT | NEWSHIFT | S/N |
| 0 | 02860077 | 0.410639 | 0.00000 | 19.1689 | 02860082 | 0.000606814 | 0.410032 | 19.1892 |
| 1 | 02860080 | 0.408359 | 0.00228000 | 19.1682 | 02860079 | -0.00111921 | 0.411758 | 19.1511 |
| 2 | 02860076 | 0.409305 | 0.00133398 | 19.1668 | 02860078 | 0.000892652 | 0.409746 | 19.1486 |
| 3 | 02860081 | 0.409641 | 0.000997990 | 19.1631 | 02860075 | 0.00000 | 0.410639 | 19.1336 |