| Red | Green | Blue | |
| z | 17.64 | ||
| znorm | Inf | ||
| sky | -Inf | -NaN | -Inf |
| S/N | 24.6 | 43.4 | 47.7 |
| S/N(c) | 0.0 | 0.0 | 0.0 |
| SN(E/C) |
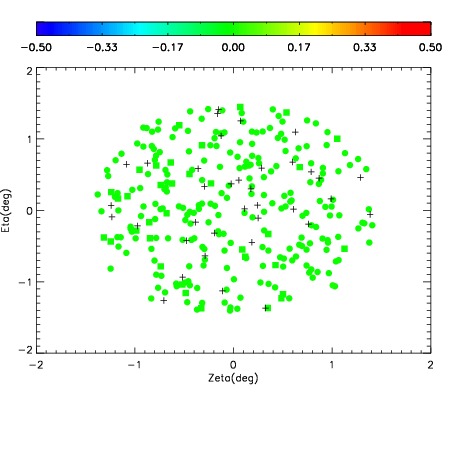
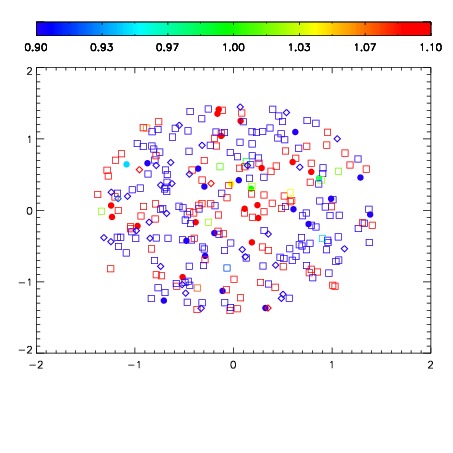
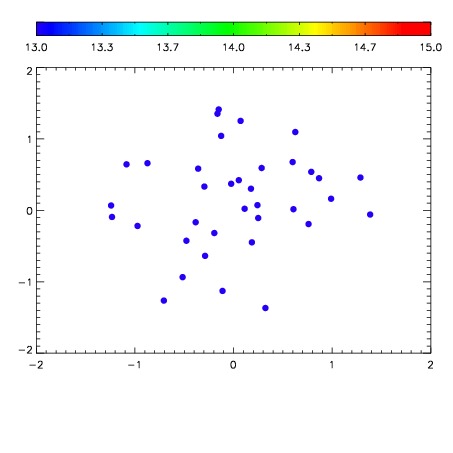

| Frame | Nreads | Zeropoints | Mag plots | Spatial mag deviation | Spatial sky 16325A emission deviations (filled: sky, open: star) | Spatial sky continuum emission | Spatial sky telluric CO2 absorption deviations (filled: H < 10) | |||||||||||||||||||||||
| 0 | 0 |
|
|
|
|
|
|
| IPAIR | NAME | SHIFT | NEWSHIFT | S/N | NAME | SHIFT | NEWSHIFT | S/N |
| 0 | 02900042 | 0.401306 | 0.00000 | 19.0078 | 02900043 | 0.00122469 | 0.400081 | 18.9929 |
| 1 | 02900041 | 0.399914 | 0.00139201 | 19.0519 | 02900039 | 0.000472400 | 0.400834 | 19.0423 |
| 2 | 02900038 | 0.401023 | 0.000283003 | 19.0168 | 02900040 | 0.00119702 | 0.400109 | 19.0189 |
| 3 | 02900037 | 0.398110 | 0.00319600 | 18.9739 | 02900036 | 0.00000 | 0.401306 | 18.9160 |