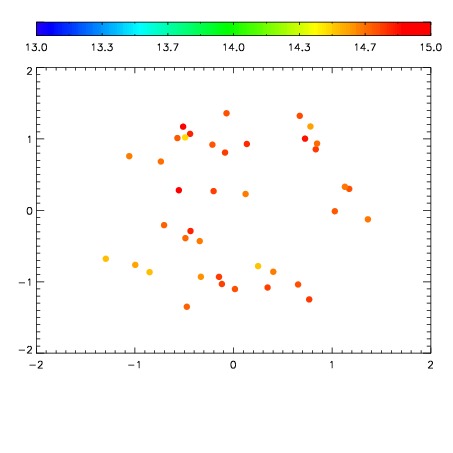
| Frame | Nreads | Zeropoints | Mag plots
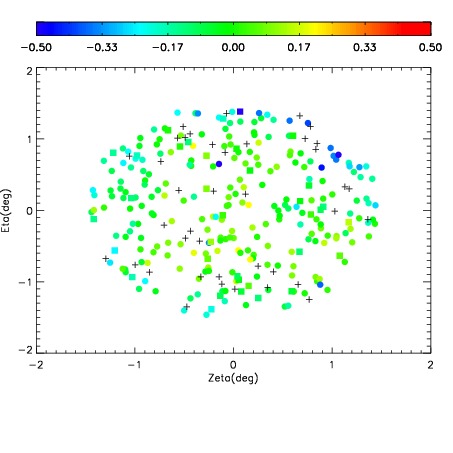
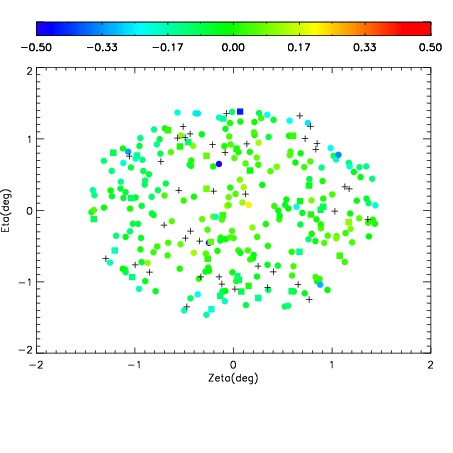
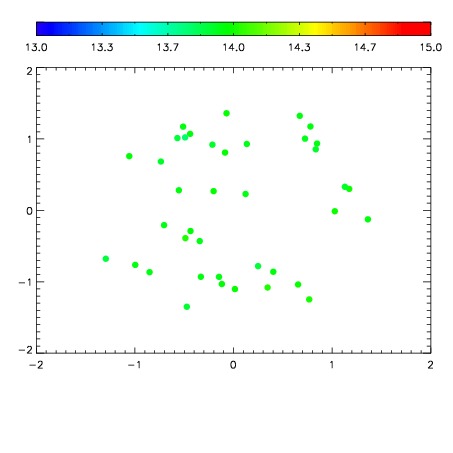
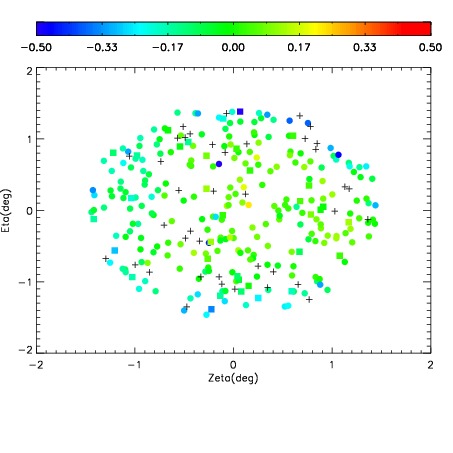
| Spatial mag deviation
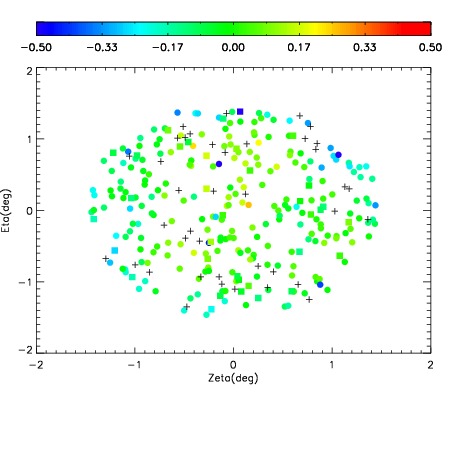
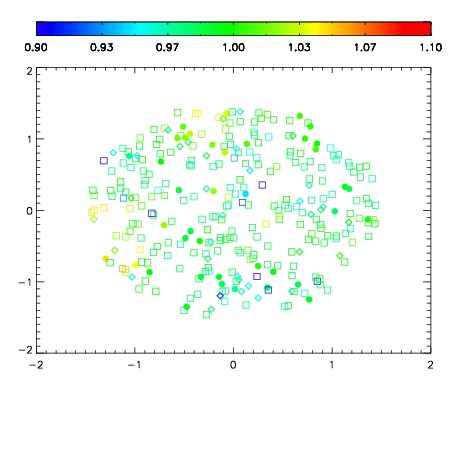
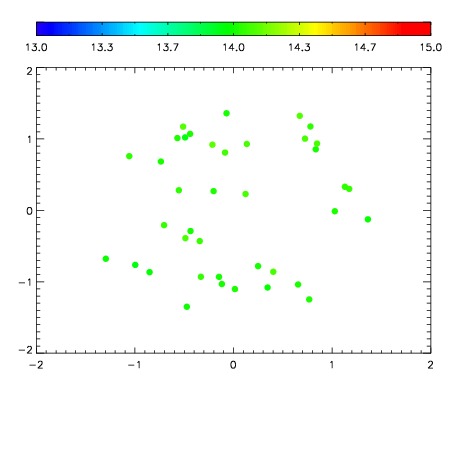
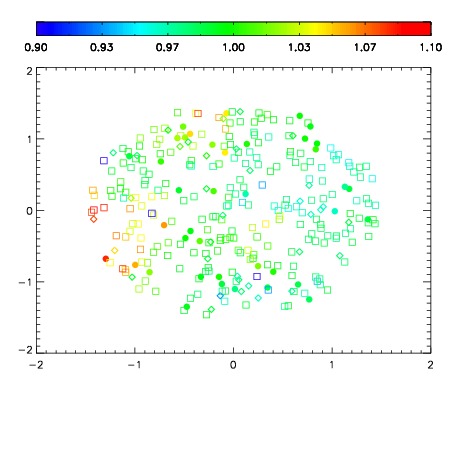
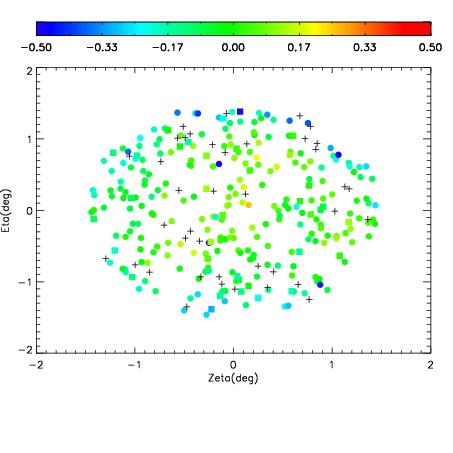
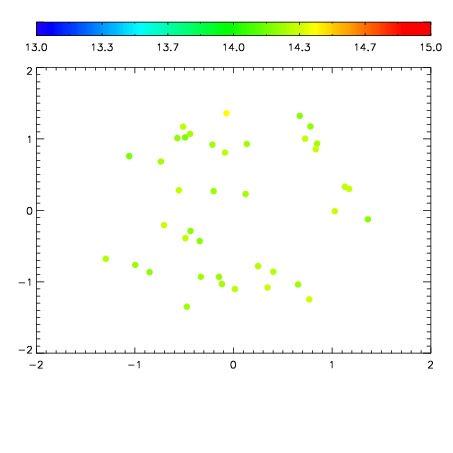
| Spatial sky 16325A emission deviations (filled: sky, open: star)
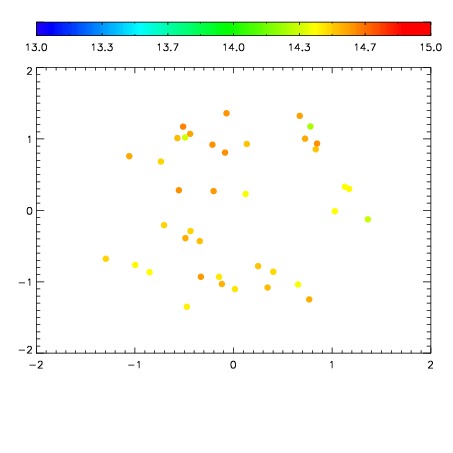
| Spatial sky continuum emission
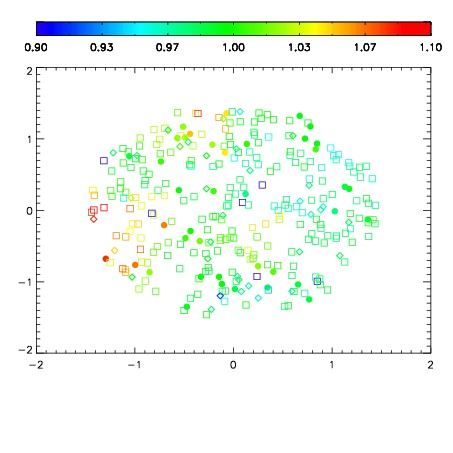
| Spatial sky telluric CO2 absorption deviations (filled: H < 10)
|
| 3100065
| 47
| | Red | Green | Blue
| | z | | 18.05
| | znorm | | 13.87
| | sky | 14.2 | 14.0 | 14.0
| | S/N | 8.0 | 14.9 | 15.6
| | S/N(c) | 7.4 | 16.9 | 12.5
| | SN(E/C) 1.00
|
| 
| 
| 
| 
| 
|
| 3100066
| 47
| | Red | Green | Blue
| | z | | 18.61
| | znorm | | 14.43
| | sky | 14.5 | 14.5 | 14.7
| | S/N | 12.0 | 20.9 | 21.9
| | S/N(c) | 10.6 | 22.4 | 17.0
| | SN(E/C) 0.95
|
| 
| 
| 
| 
| 
|
| 3100067
| 47
| | Red | Green | Blue
| | z | | 17.32
| | znorm | | 13.13
| | sky | 14.1 | 14.0 | 14.1
| | S/N | 3.8 | 8.3 | 8.9
| | S/N(c) | 4.2 | 10.7 | 8.3
| | SN(E/C) 1.02
|
| 
| 
| 
| 
| 
|
| 3100068
| 47
| | Red | Green | Blue
| | z | | 16.92
| | znorm | | 12.74
| | sky | 14.2 | 14.0 | 14.2
| | S/N | 2.8 | 6.5 | 6.9
| | S/N(c) | 3.3 | 8.5 | 6.8
| | SN(E/C) 1.04
|
| 
| 
| 
| 
| 
|
| 3100069
| 47
| | Red | Green | Blue
| | z | | 18.13
| | znorm | | 13.95
| | sky | 14.6 | 14.7 | 14.9
| | S/N | 8.1 | 15.7 | 16.4
| | S/N(c) | 8.1 | 17.5 | 13.4
| | SN(E/C) 0.96
|
| 
| 
| 
| 
| 
|
| 3100070
| 47
| | Red | Green | Blue
| | z | | 16.86
| | znorm | | 12.68
| | sky | 14.0 | 13.9 | 14.0
| | S/N | 2.6 | 6.1 | 6.2
| | S/N(c) | 2.9 | 7.8 | 6.3
| | SN(E/C) 1.00
|
| 
| 
| 
| 
| 
|
| 3100071
| 47
| | Red | Green | Blue
| | z | | 18.11
| | znorm | | 13.93
| | sky | 14.6 | 14.3 | 14.4
| | S/N | 8.3 | 15.2 | 15.8
| | S/N(c) | 7.9 | 17.0 | 13.2
| | SN(E/C) 0.96
|
| 
| 
| 
| 
| 
|
| 3100072
| 47
| | Red | Green | Blue
| | z | | 17.94
| | znorm | | 13.76
| | sky | 14.5 | 14.3 | 14.4
| | S/N | 7.1 | 13.5 | 14.1
| | S/N(c) | 6.7 | 15.7 | 12.3
| | SN(E/C) 1.03
|
| 
| 
| 
| 
| 
|