| Red | Green | Blue | |
| z | 17.64 | ||
| znorm | Inf | ||
| sky | -Inf | -Inf | -Inf |
| S/N | 12.4 | 24.6 | 26.0 |
| S/N(c) | 0.0 | 0.0 | 0.0 |
| SN(E/C) |
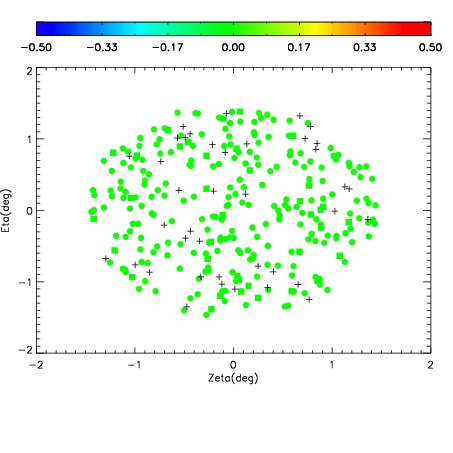
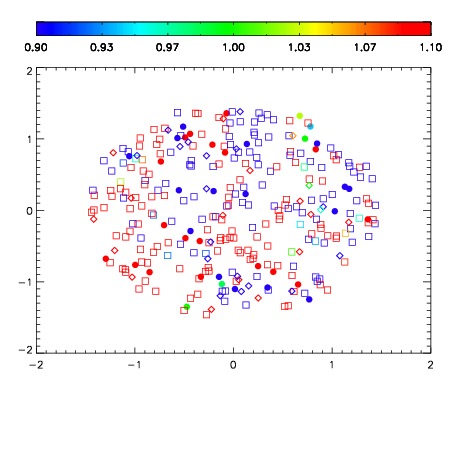
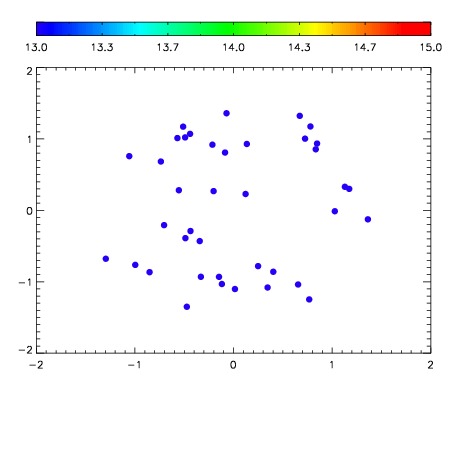

| Frame | Nreads | Zeropoints | Mag plots | Spatial mag deviation | Spatial sky 16325A emission deviations (filled: sky, open: star) | Spatial sky continuum emission | Spatial sky telluric CO2 absorption deviations (filled: H < 10) | |||||||||||||||||||||||
| 0 | 0 |
|
|
|
|
|
|
| IPAIR | NAME | SHIFT | NEWSHIFT | S/N | NAME | SHIFT | NEWSHIFT | S/N |
| 0 | 03100070 | 0.494558 | 0.00000 | 16.8333 | 03100068 | -0.000413203 | 0.494971 | 16.9178 |
| 1 | 03100066 | 0.492609 | 0.00194901 | 18.5905 | 03100069 | -0.00126147 | 0.495819 | 18.1118 |
| 2 | 03100071 | 0.494446 | 0.000111997 | 18.0921 | 03100065 | 0.00000 | 0.494558 | 18.0408 |
| 3 | 03100067 | 0.493584 | 0.000974000 | 17.2968 | 03100072 | -0.000820824 | 0.495379 | 17.9254 |