| Red | Green | Blue | |
| z | 17.64 | ||
| znorm | Inf | ||
| sky | -Inf | -Inf | -NaN |
| S/N | 15.6 | 28.4 | 29.9 |
| S/N(c) | 0.0 | 0.0 | 0.0 |
| SN(E/C) |
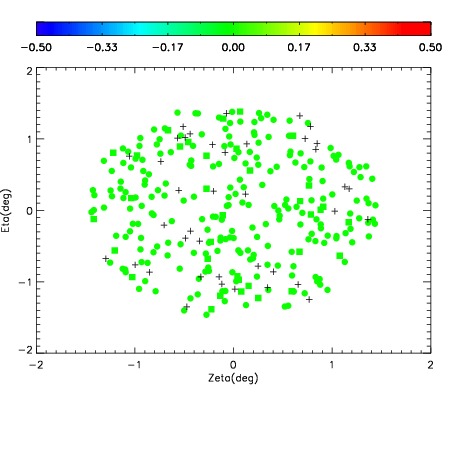
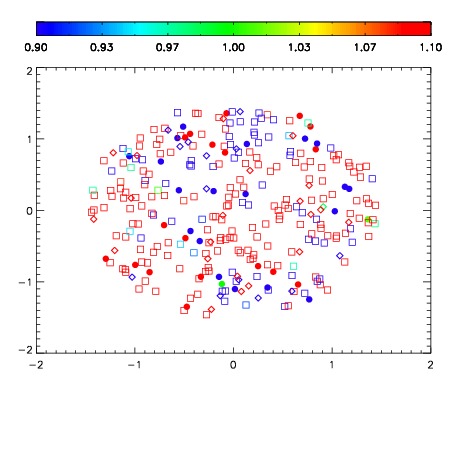
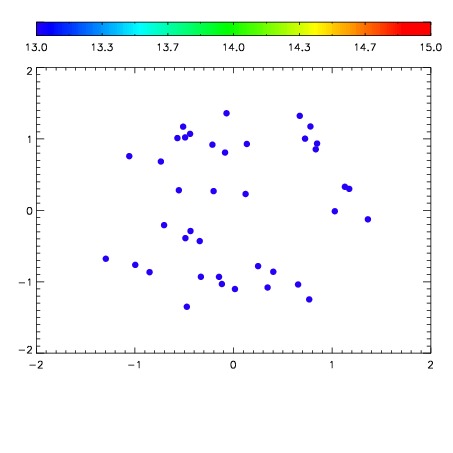

| Frame | Nreads | Zeropoints | Mag plots | Spatial mag deviation | Spatial sky 16325A emission deviations (filled: sky, open: star) | Spatial sky continuum emission | Spatial sky telluric CO2 absorption deviations (filled: H < 10) | |||||||||||||||||||||||
| 0 | 0 |
|
|
|
|
|
|
| IPAIR | NAME | SHIFT | NEWSHIFT | S/N | NAME | SHIFT | NEWSHIFT | S/N |
| 0 | 03110031 | 0.490575 | 0.00000 | 18.5379 | 03110029 | 0.00000 | 0.490575 | 18.5743 |
| 1 | 03110030 | 0.489812 | 0.000762999 | 18.5616 | 03110033 | 0.000297441 | 0.490278 | 18.7177 |
| 2 | 03110034 | 0.484756 | 0.00581899 | 16.6624 | 03110032 | 0.00103419 | 0.489541 | 18.5239 |