| Red | Green | Blue | |
| z | 17.64 | ||
| znorm | Inf | ||
| sky | -Inf | -Inf | -NaN |
| S/N | 26.8 | 47.9 | 52.5 |
| S/N(c) | 0.0 | 0.0 | 0.0 |
| SN(E/C) |
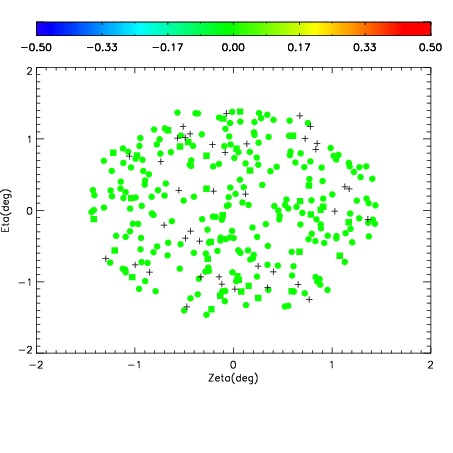
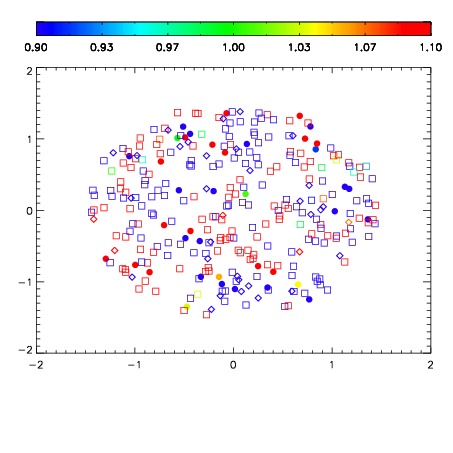
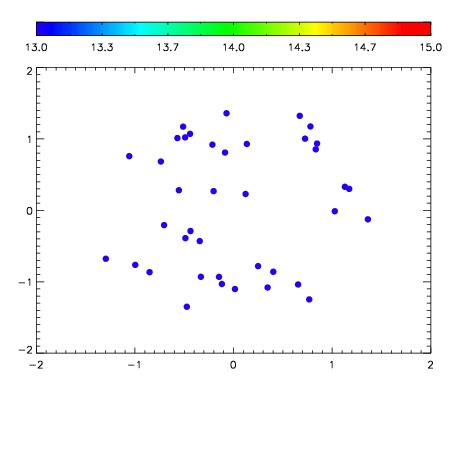

| Frame | Nreads | Zeropoints | Mag plots | Spatial mag deviation | Spatial sky 16325A emission deviations (filled: sky, open: star) | Spatial sky continuum emission | Spatial sky telluric CO2 absorption deviations (filled: H < 10) | |||||||||||||||||||||||
| 0 | 0 |
|
|
|
|
|
|
| IPAIR | NAME | SHIFT | NEWSHIFT | S/N | NAME | SHIFT | NEWSHIFT | S/N |
| 0 | 03120068 | 0.499405 | 0.00000 | 18.9393 | 03120069 | 0.00511013 | 0.494295 | 18.9638 |
| 1 | 03120064 | 0.494009 | 0.00539601 | 19.0239 | 03120065 | 0.00270185 | 0.496703 | 19.0480 |
| 2 | 03120063 | 0.493174 | 0.00623101 | 18.9643 | 03120066 | 0.00121626 | 0.498189 | 19.0275 |
| 3 | 03120067 | 0.497416 | 0.00198901 | 18.9299 | 03120062 | 0.00000 | 0.499405 | 18.9451 |