| Red | Green | Blue | |
| z | 17.64 | ||
| znorm | Inf | ||
| sky | -NaN | -NaN | -Inf |
| S/N | 27.4 | 46.4 | 51.3 |
| S/N(c) | 0.0 | 0.0 | 0.0 |
| SN(E/C) |
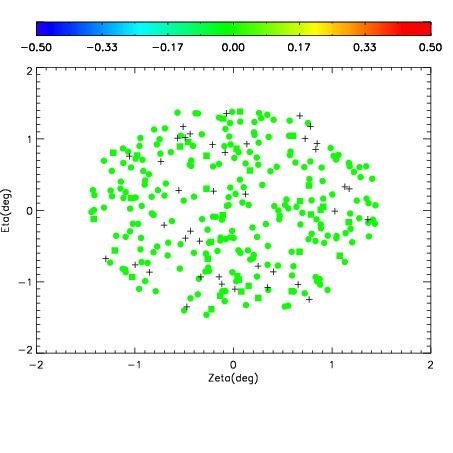
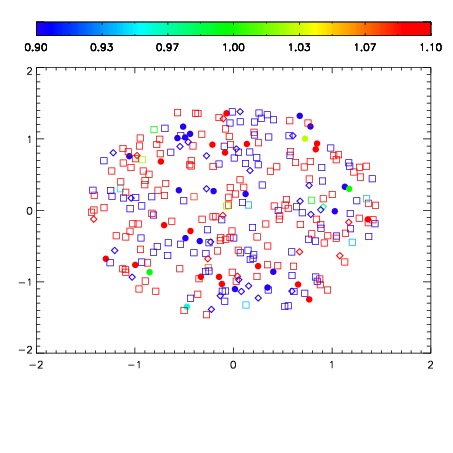
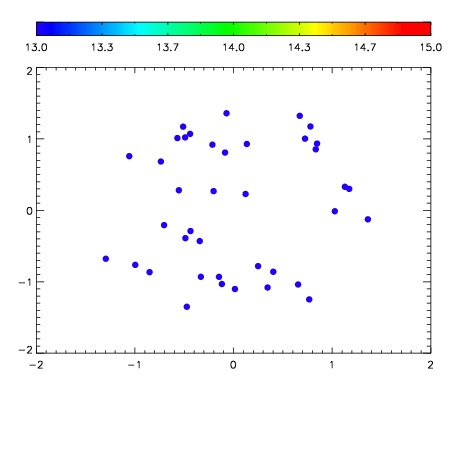

| Frame | Nreads | Zeropoints | Mag plots | Spatial mag deviation | Spatial sky 16325A emission deviations (filled: sky, open: star) | Spatial sky continuum emission | Spatial sky telluric CO2 absorption deviations (filled: H < 10) | |||||||||||||||||||||||
| 0 | 0 |
|
|
|
|
|
|
| IPAIR | NAME | SHIFT | NEWSHIFT | S/N | NAME | SHIFT | NEWSHIFT | S/N |
| 0 | 03440048 | 0.505372 | 0.00000 | 19.0252 | 03440050 | 0.00142226 | 0.503950 | 19.0746 |
| 1 | 03440047 | 0.503552 | 0.00181997 | 19.0844 | 03440046 | 0.00000 | 0.505372 | 19.1121 |
| 2 | 03440051 | 0.503683 | 0.00168902 | 19.0010 | 03440049 | 0.00174466 | 0.503627 | 19.0484 |
| 3 | 03440052 | 0.504434 | 0.000937998 | 18.9607 | 03440053 | 0.00199393 | 0.503378 | 19.0108 |