| Red | Green | Blue | |
| z | 17.64 | ||
| znorm | Inf | ||
| sky | -Inf | -Inf | -Inf |
| S/N | 29.4 | 50.8 | 53.1 |
| S/N(c) | 0.0 | 0.0 | 0.0 |
| SN(E/C) |
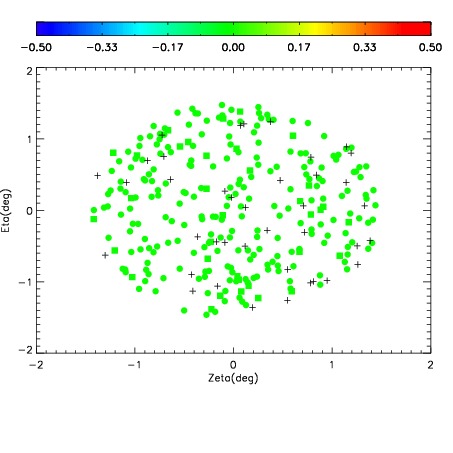
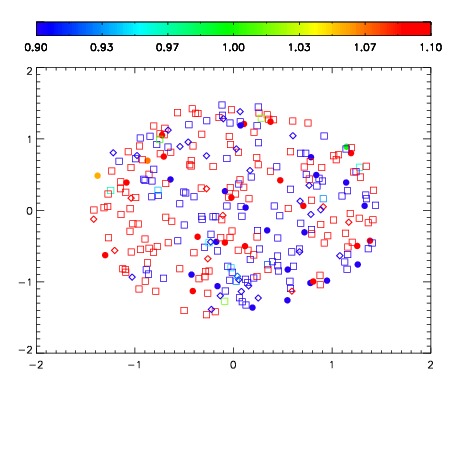


| Frame | Nreads | Zeropoints | Mag plots | Spatial mag deviation | Spatial sky 16325A emission deviations (filled: sky, open: star) | Spatial sky continuum emission | Spatial sky telluric CO2 absorption deviations (filled: H < 10) | |||||||||||||||||||||||
| 0 | 0 |
|
|
|
|
|
|
| IPAIR | NAME | SHIFT | NEWSHIFT | S/N | NAME | SHIFT | NEWSHIFT | S/N |
| 0 | 02930029 | 0.404661 | 0.00000 | 19.1715 | 02930027 | 0.000408150 | 0.404253 | 19.1627 |
| 1 | 02930024 | 0.402075 | 0.00258601 | 19.2005 | 02930030 | 0.00181103 | 0.402850 | 19.2002 |
| 2 | 02930025 | 0.403331 | 0.00132999 | 19.1881 | 02930026 | 0.00172178 | 0.402939 | 19.1963 |
| 3 | 02930028 | 0.403341 | 0.00132000 | 19.1720 | 02930023 | 0.00000 | 0.404661 | 19.1656 |