| Red | Green | Blue | |
| z | 17.64 | ||
| znorm | Inf | ||
| sky | -NaN | -NaN | -Inf |
| S/N | 27.7 | 47.2 | 50.2 |
| S/N(c) | 0.0 | 0.0 | 0.0 |
| SN(E/C) |
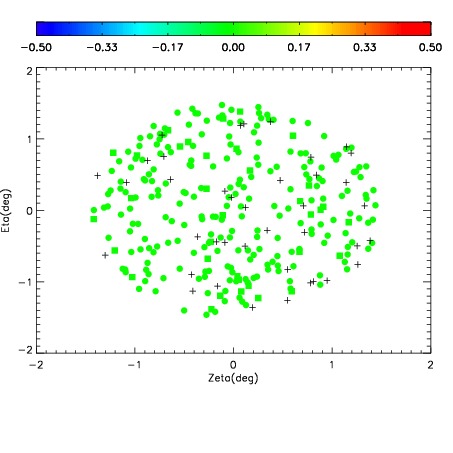
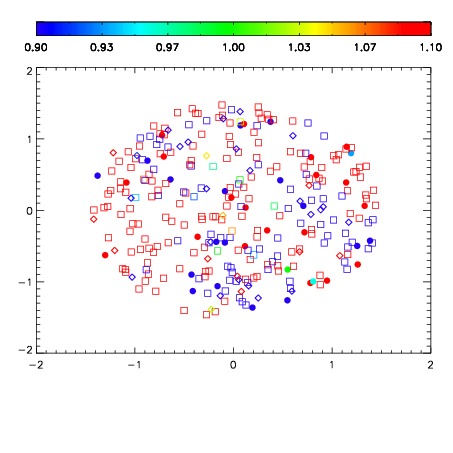
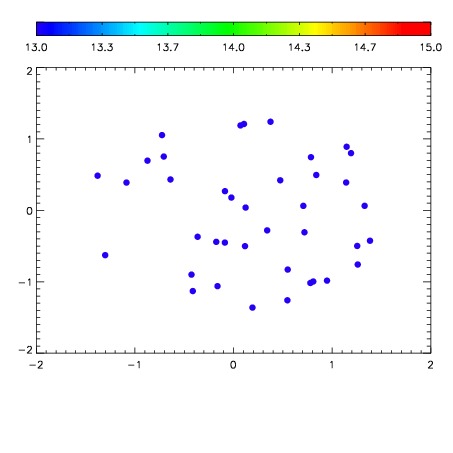

| Frame | Nreads | Zeropoints | Mag plots | Spatial mag deviation | Spatial sky 16325A emission deviations (filled: sky, open: star) | Spatial sky continuum emission | Spatial sky telluric CO2 absorption deviations (filled: H < 10) | |||||||||||||||||||||||
| 0 | 0 |
|
|
|
|
|
|
| IPAIR | NAME | SHIFT | NEWSHIFT | S/N | NAME | SHIFT | NEWSHIFT | S/N |
| 0 | 03690036 | 0.494257 | 0.00000 | 18.9441 | 03690037 | -0.00140287 | 0.495660 | 18.9740 |
| 1 | 03690039 | 0.492831 | 0.00142601 | 19.0471 | 03690038 | -0.00221250 | 0.496469 | 19.0735 |
| 2 | 03690040 | 0.493898 | 0.000358999 | 18.9905 | 03690041 | -0.00161278 | 0.495870 | 19.0345 |
| 3 | 03690035 | 0.492729 | 0.00152799 | 18.8882 | 03690034 | 0.00000 | 0.494257 | 18.7733 |