| Red | Green | Blue | |
| z | 17.64 | ||
| znorm | Inf | ||
| sky | -NaN | -NaN | -NaN |
| S/N | 30.4 | 48.0 | 52.0 |
| S/N(c) | 0.0 | 0.0 | 0.0 |
| SN(E/C) |
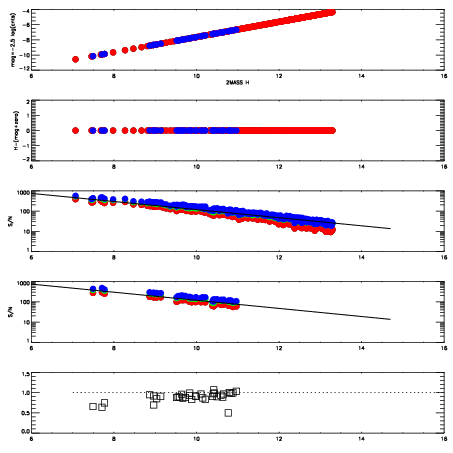
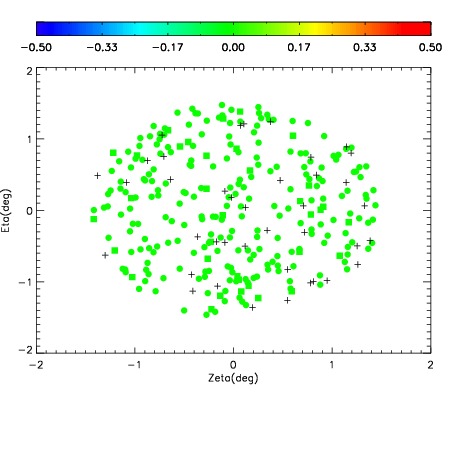
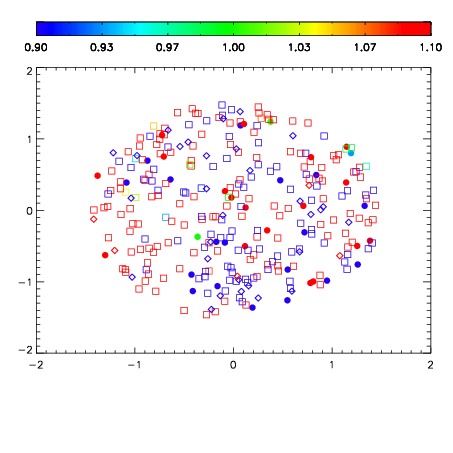


| Frame | Nreads | Zeropoints | Mag plots | Spatial mag deviation | Spatial sky 16325A emission deviations (filled: sky, open: star) | Spatial sky continuum emission | Spatial sky telluric CO2 absorption deviations (filled: H < 10) | |||||||||||||||||||||||
| 0 | 0 |
|
|
|
|
|
|
| IPAIR | NAME | SHIFT | NEWSHIFT | S/N | NAME | SHIFT | NEWSHIFT | S/N |
| 0 | 03940026 | 0.499850 | 0.00000 | 19.0881 | 03940029 | -0.000565585 | 0.500416 | 19.1048 |
| 1 | 03940031 | 0.494184 | 0.00566602 | 19.1387 | 03940032 | -0.00224657 | 0.502097 | 19.1801 |
| 2 | 03940030 | 0.494300 | 0.00555000 | 19.1242 | 03940025 | 0.00000 | 0.499850 | 19.1083 |
| 3 | 03940027 | 0.499359 | 0.000490993 | 18.9988 | 03940028 | -0.000472730 | 0.500323 | 19.0490 |