| Red | Green | Blue | |
| z | 17.64 | ||
| znorm | Inf | ||
| sky | -NaN | -NaN | -Inf |
| S/N | 29.7 | 49.0 | 52.2 |
| S/N(c) | 0.0 | 0.0 | 0.0 |
| SN(E/C) |
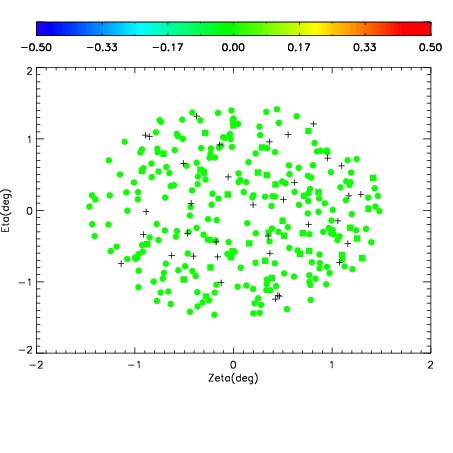
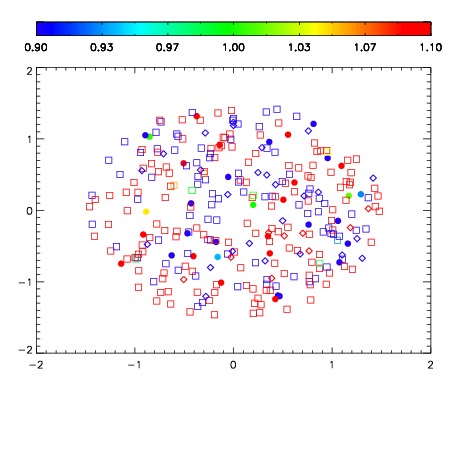
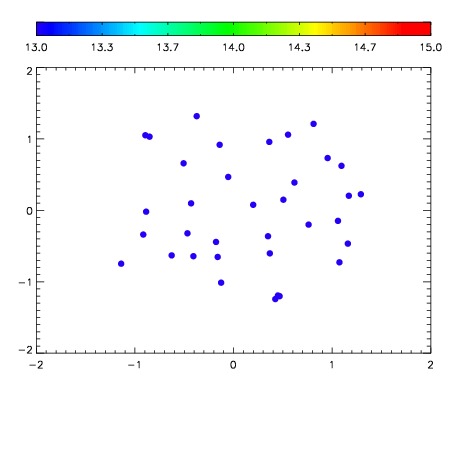

| Frame | Nreads | Zeropoints | Mag plots | Spatial mag deviation | Spatial sky 16325A emission deviations (filled: sky, open: star) | Spatial sky continuum emission | Spatial sky telluric CO2 absorption deviations (filled: H < 10) | |||||||||||||||||||||||
| 0 | 0 |
|
|
|
|
|
|
| IPAIR | NAME | SHIFT | NEWSHIFT | S/N | NAME | SHIFT | NEWSHIFT | S/N |
| 0 | 03200049 | 0.511669 | 0.00000 | 19.1085 | 03200050 | 0.00160984 | 0.510059 | 19.1682 |
| 1 | 03200052 | 0.508414 | 0.00325501 | 19.1943 | 03200054 | 0.00458884 | 0.507080 | 19.1943 |
| 2 | 03200053 | 0.509101 | 0.00256801 | 19.1826 | 03200051 | 0.00208793 | 0.509581 | 19.1795 |
| 3 | 03200048 | 0.501559 | 0.0101100 | 19.0707 | 03200047 | 0.00000 | 0.511669 | 19.0374 |