| Red | Green | Blue | |
| z | 17.63 | ||
| znorm | Inf | ||
| sky | -NaN | -Inf | -Inf |
| S/N | 30.6 | 51.6 | 53.6 |
| S/N(c) | 0.0 | 0.0 | 0.0 |
| SN(E/C) |
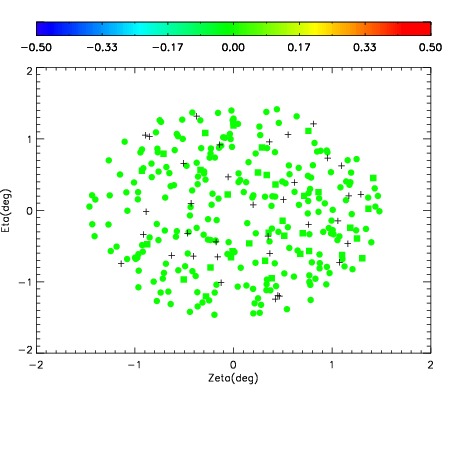
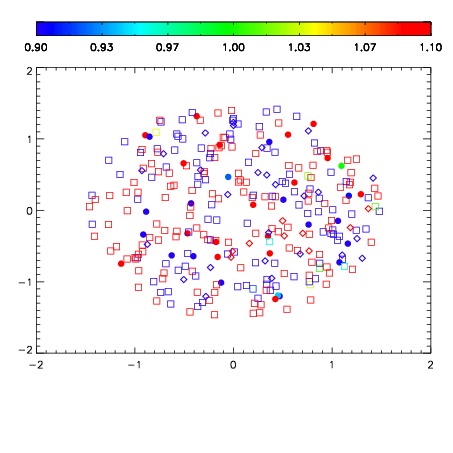
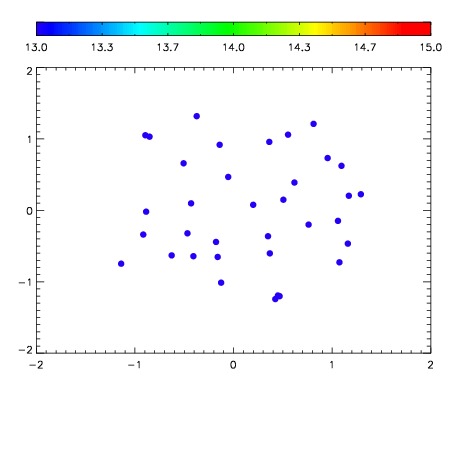

| Frame | Nreads | Zeropoints | Mag plots | Spatial mag deviation | Spatial sky 16325A emission deviations (filled: sky, open: star) | Spatial sky continuum emission | Spatial sky telluric CO2 absorption deviations (filled: H < 10) | |||||||||||||||||||||||
| 0 | 0 |
|
|
|
|
|
|
| IPAIR | NAME | SHIFT | NEWSHIFT | S/N | NAME | SHIFT | NEWSHIFT | S/N |
| 0 | 03670043 | 0.501563 | 0.00000 | 19.2409 | 03670041 | 0.000754051 | 0.500809 | 19.2526 |
| 1 | 03670042 | 0.498976 | 0.00258702 | 19.2354 | 03670044 | 0.00310116 | 0.498462 | 19.2470 |
| 2 | 03670039 | 0.498980 | 0.00258303 | 19.2204 | 03670040 | 0.00124544 | 0.500318 | 19.2301 |
| 3 | 03670038 | 0.497841 | 0.00372201 | 19.2200 | 03670037 | 0.00000 | 0.501563 | 19.2104 |