| Red | Green | Blue | |
| z | 17.64 | ||
| znorm | Inf | ||
| sky | -NaN | -NaN | -Inf |
| S/N | 16.9 | 30.9 | 32.2 |
| S/N(c) | 0.0 | 0.0 | 0.0 |
| SN(E/C) |
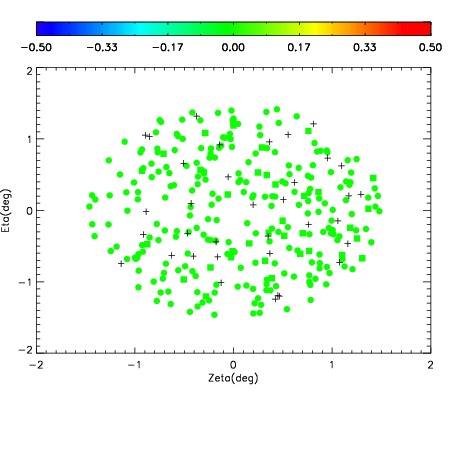
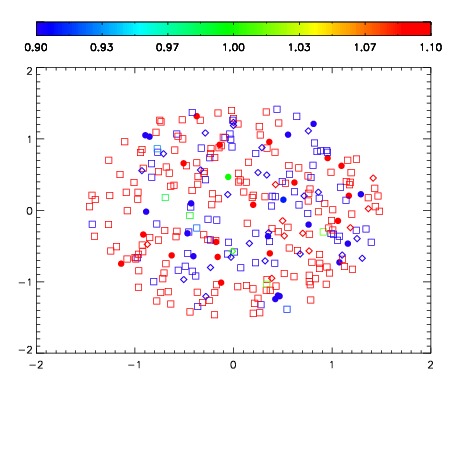
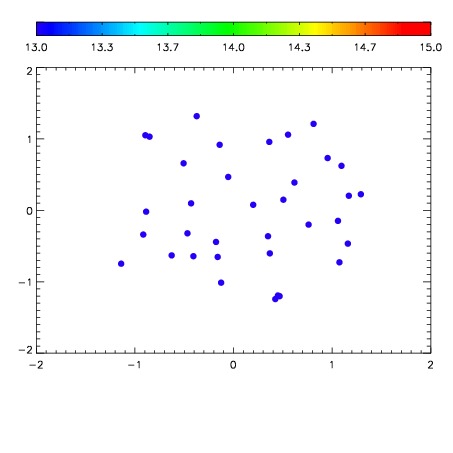

| Frame | Nreads | Zeropoints | Mag plots | Spatial mag deviation | Spatial sky 16325A emission deviations (filled: sky, open: star) | Spatial sky continuum emission | Spatial sky telluric CO2 absorption deviations (filled: H < 10) | |||||||||||||||||||||||
| 0 | 0 |
|
|
|
|
|
|
| IPAIR | NAME | SHIFT | NEWSHIFT | S/N | NAME | SHIFT | NEWSHIFT | S/N |
| 0 | 03770016 | 0.512720 | 0.00000 | 18.1716 | 03770017 | 0.00537430 | 0.507346 | 18.6727 |
| 1 | 03770012 | 0.511874 | 0.000845969 | 18.3680 | 03770013 | 0.00318720 | 0.509533 | 18.8347 |
| 2 | 03770011 | 0.510453 | 0.00226700 | 18.2380 | 03770014 | 0.00369392 | 0.509026 | 18.7794 |
| 3 | 03770015 | 0.511555 | 0.00116497 | 17.8369 | 03770010 | 0.00000 | 0.512720 | 18.0861 |