| Red | Green | Blue | |
| z | 17.64 | ||
| znorm | Inf | ||
| sky | -Inf | -Inf | -Inf |
| S/N | 22.9 | 37.1 | 38.9 |
| S/N(c) | 0.0 | 0.0 | 0.0 |
| SN(E/C) |

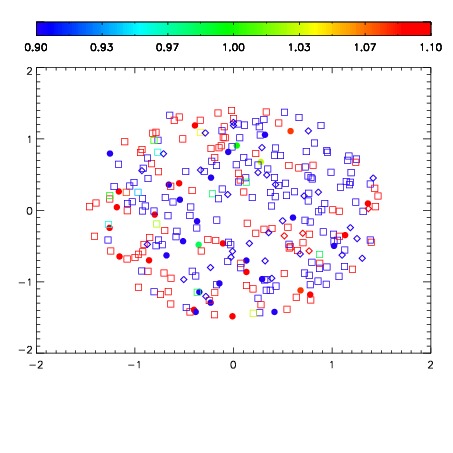
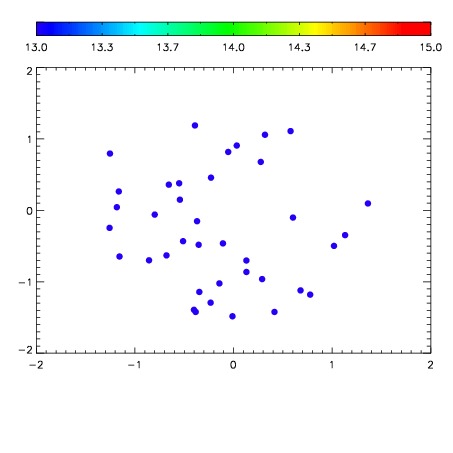

| Frame | Nreads | Zeropoints | Mag plots | Spatial mag deviation | Spatial sky 16325A emission deviations (filled: sky, open: star) | Spatial sky continuum emission | Spatial sky telluric CO2 absorption deviations (filled: H < 10) | |||||||||||||||||||||||
| 0 | 0 |
|
|
|
|
|
|
| IPAIR | NAME | SHIFT | NEWSHIFT | S/N | NAME | SHIFT | NEWSHIFT | S/N |
| 0 | 04030018 | 0.505022 | 0.00000 | 18.7706 | 04030015 | 0.00119644 | 0.503826 | 19.0101 |
| 1 | 04030017 | 0.503782 | 0.00124002 | 19.0972 | 04030019 | 0.00508726 | 0.499935 | 19.0725 |
| 2 | 04030013 | 0.502550 | 0.00247198 | 18.1798 | 04030016 | 0.00185834 | 0.503164 | 19.0029 |
| 3 | 04030014 | 0.504446 | 0.000575960 | 16.3854 | 04030012 | 0.00000 | 0.505022 | 18.1871 |