| Red | Green | Blue | |
| z | 17.64 | ||
| znorm | Inf | ||
| sky | -Inf | -Inf | -Inf |
| S/N | 27.6 | 45.1 | 47.4 |
| S/N(c) | 0.0 | 0.0 | 0.0 |
| SN(E/C) |
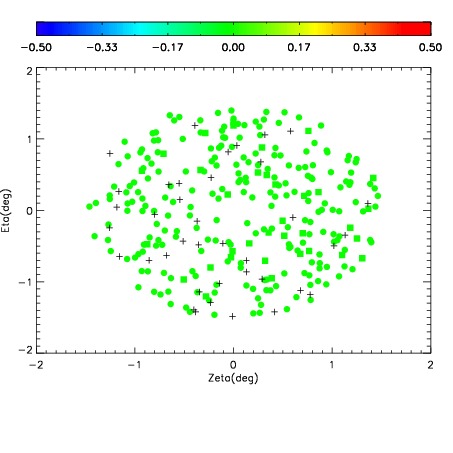
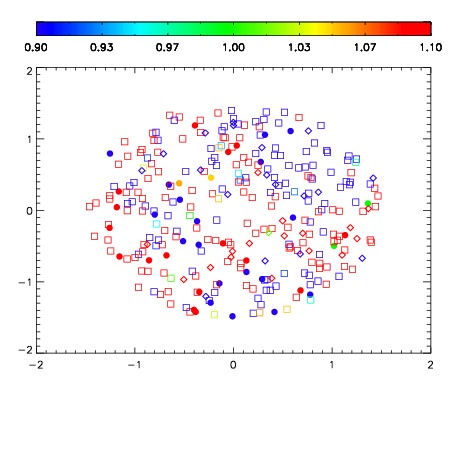
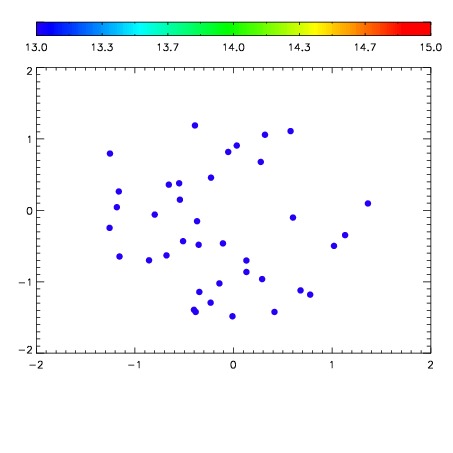

| Frame | Nreads | Zeropoints | Mag plots | Spatial mag deviation | Spatial sky 16325A emission deviations (filled: sky, open: star) | Spatial sky continuum emission | Spatial sky telluric CO2 absorption deviations (filled: H < 10) | |||||||||||||||||||||||
| 0 | 0 |
|
|
|
|
|
|
| IPAIR | NAME | SHIFT | NEWSHIFT | S/N | NAME | SHIFT | NEWSHIFT | S/N |
| 0 | 06700080 | 0.475860 | 0.00000 | 19.1445 | 06700078 | 0.00414111 | 0.471719 | 19.1041 |
| 1 | 06700079 | 0.475052 | 0.000808001 | 19.1570 | 06700074 | 0.00000 | 0.475860 | 19.1386 |
| 2 | 06700075 | 0.474376 | 0.00148401 | 19.0934 | 06700077 | 0.00170267 | 0.474157 | 19.1017 |
| 3 | 06700076 | 0.475448 | 0.000411987 | 19.0744 | 06700081 | 0.00412257 | 0.471737 | 19.0950 |