| Red | Green | Blue | |
| z | 17.64 | ||
| znorm | Inf | ||
| sky | -NaN | -NaN | -Inf |
| S/N | 20.6 | 37.6 | 39.4 |
| S/N(c) | 0.0 | 0.0 | 0.0 |
| SN(E/C) |
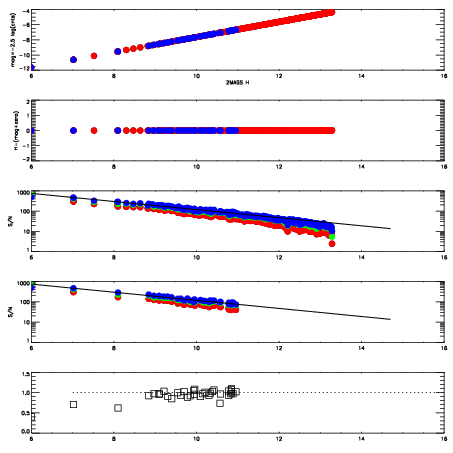
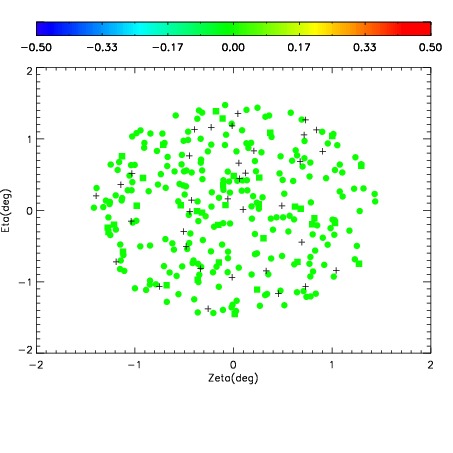
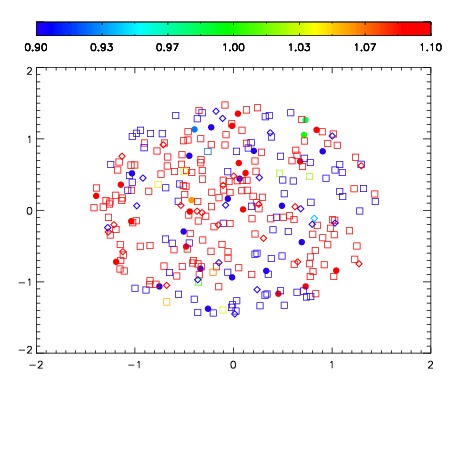
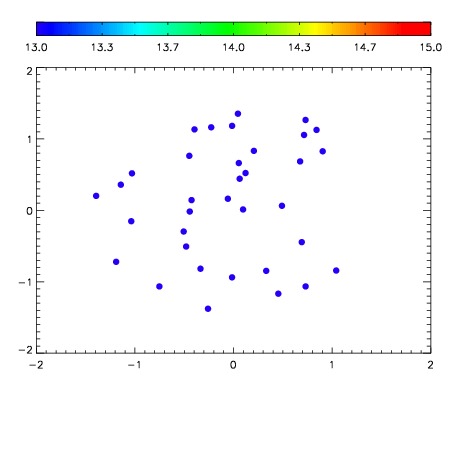

| Frame | Nreads | Zeropoints | Mag plots | Spatial mag deviation | Spatial sky 16325A emission deviations (filled: sky, open: star) | Spatial sky continuum emission | Spatial sky telluric CO2 absorption deviations (filled: H < 10) | |||||||||||||||||||||||
| 0 | 0 |
|
|
|
|
|
|
| IPAIR | NAME | SHIFT | NEWSHIFT | S/N | NAME | SHIFT | NEWSHIFT | S/N |
| 0 | 04050016 | 0.502335 | 0.00000 | 18.3130 | 04050017 | 0.00207092 | 0.500264 | 18.5116 |
| 1 | 04050012 | 0.501788 | 0.000546992 | 18.7395 | 04050013 | 0.00125950 | 0.501076 | 18.7025 |
| 2 | 04050011 | 0.499998 | 0.00233701 | 18.5925 | 04050010 | 0.00000 | 0.502335 | 18.6025 |
| 3 | 04050015 | 0.500216 | 0.00211900 | 18.4824 | 04050014 | 0.000507474 | 0.501828 | 18.5485 |