| Red | Green | Blue | |
| z | 17.64 | ||
| znorm | Inf | ||
| sky | -Inf | -NaN | -Inf |
| S/N | 25.9 | 42.8 | 45.8 |
| S/N(c) | 0.0 | 0.0 | 0.0 |
| SN(E/C) |

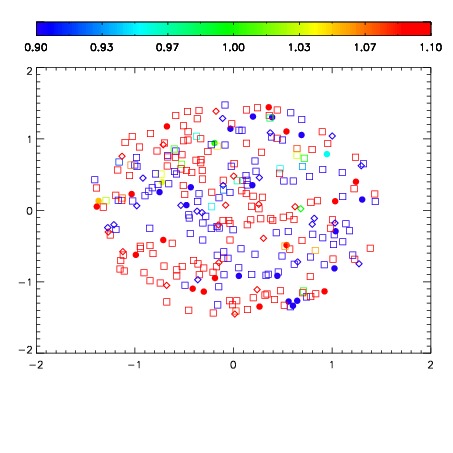
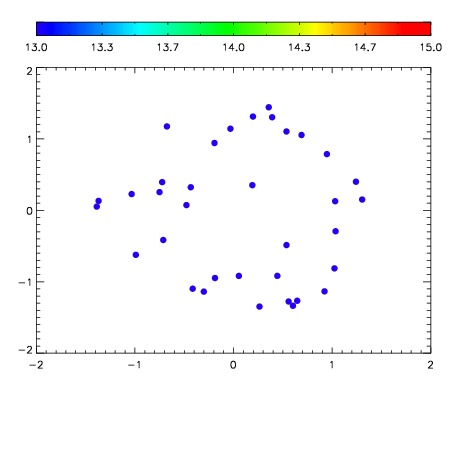

| Frame | Nreads | Zeropoints | Mag plots | Spatial mag deviation | Spatial sky 16325A emission deviations (filled: sky, open: star) | Spatial sky continuum emission | Spatial sky telluric CO2 absorption deviations (filled: H < 10) | |||||||||||||||||||||||
| 0 | 0 |
|
|
|
|
|
|
| IPAIR | NAME | SHIFT | NEWSHIFT | S/N | NAME | SHIFT | NEWSHIFT | S/N |
| 0 | 06430071 | 0.480361 | 0.00000 | 19.0772 | 06430072 | 0.000618686 | 0.479742 | 19.0823 |
| 1 | 06430070 | 0.479637 | 0.000724018 | 19.1395 | 06430069 | 0.00000 | 0.480361 | 19.1476 |
| 2 | 06430075 | 0.478997 | 0.00136402 | 18.9395 | 06430073 | 0.000936954 | 0.479424 | 19.0557 |
| 3 | 06430074 | 0.479290 | 0.00107101 | 18.9179 | 06430076 | -0.000673756 | 0.481035 | 18.8250 |