| Red | Green | Blue | |
| z | 17.65 | ||
| znorm | Inf | ||
| sky | -Inf | -Inf | -Inf |
| S/N | 6.5 | 10.9 | 12.3 |
| S/N(c) | 0.0 | 0.0 | 0.0 |
| SN(E/C) |
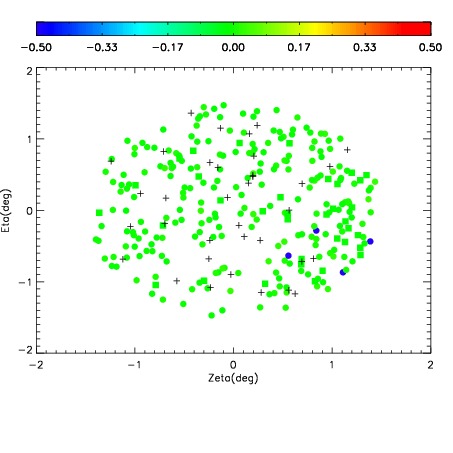
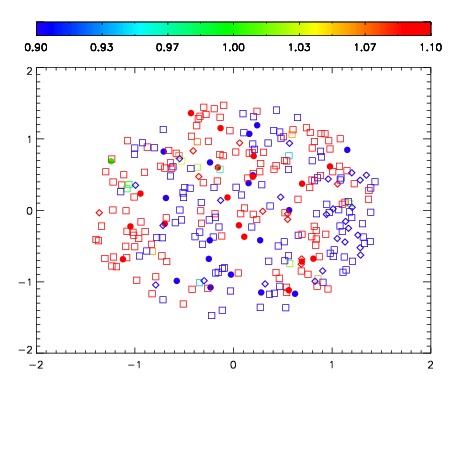


| Frame | Nreads | Zeropoints | Mag plots | Spatial mag deviation | Spatial sky 16325A emission deviations (filled: sky, open: star) | Spatial sky continuum emission | Spatial sky telluric CO2 absorption deviations (filled: H < 10) | |||||||||||||||||||||||
| 0 | 0 |
|
|
|
|
|
|
| IPAIR | NAME | SHIFT | NEWSHIFT | S/N | NAME | SHIFT | NEWSHIFT | S/N |
| 0 | 03140064 | 0.511407 | 0.00000 | 17.5328 | 03140065 | 0.000822179 | 0.510585 | 17.3966 |
| 1 | 03140063 | 0.510344 | 0.00106299 | 17.2972 | 03140062 | 0.00000 | 0.511407 | 17.3944 |
| 2 | 03140068 | 0.510529 | 0.000878036 | 17.1601 | 03140069 | -0.00172231 | 0.513129 | 17.3438 |
| 3 | 03140067 | 0.509166 | 0.00224102 | 16.5938 | 03140066 | -0.00106814 | 0.512475 | 17.0204 |