| Red | Green | Blue | |
| z | 17.64 | ||
| znorm | Inf | ||
| sky | -Inf | -NaN | -Inf |
| S/N | 33.3 | 56.2 | 59.6 |
| S/N(c) | 0.0 | 0.0 | 0.0 |
| SN(E/C) |
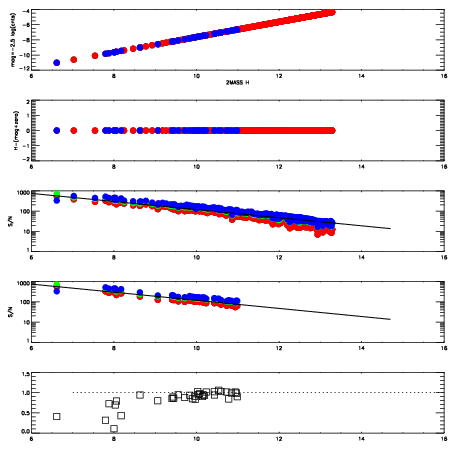
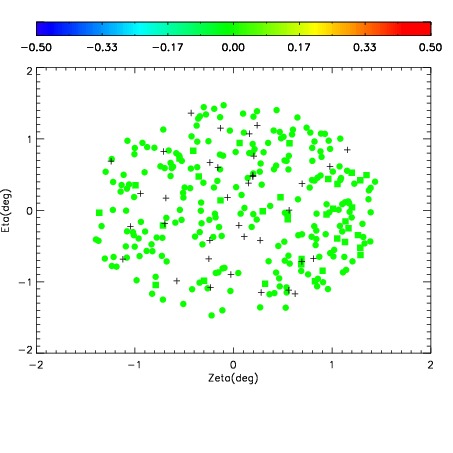
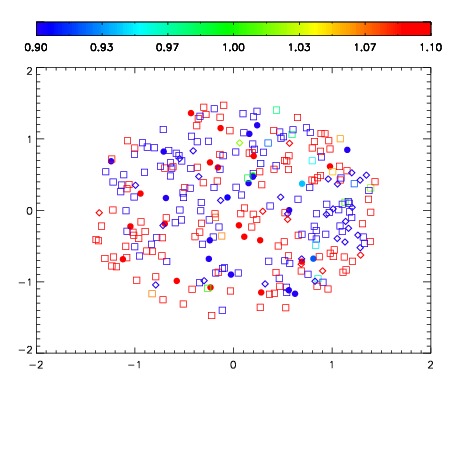
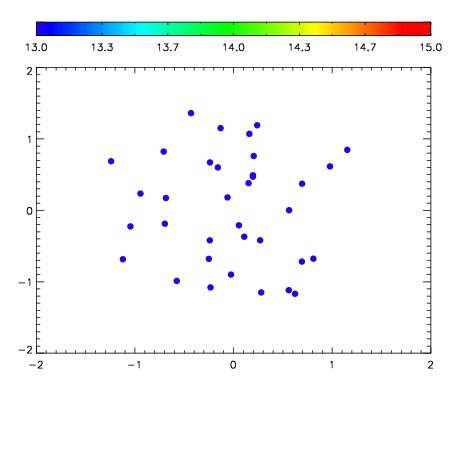

| Frame | Nreads | Zeropoints | Mag plots | Spatial mag deviation | Spatial sky 16325A emission deviations (filled: sky, open: star) | Spatial sky continuum emission | Spatial sky telluric CO2 absorption deviations (filled: H < 10) | |||||||||||||||||||||||
| 0 | 0 |
|
|
|
|
|
|
| IPAIR | NAME | SHIFT | NEWSHIFT | S/N | NAME | SHIFT | NEWSHIFT | S/N |
| 0 | 03410076 | 0.496436 | 0.00000 | 19.1285 | 03410070 | 0.00000 | 0.496436 | 19.1572 |
| 1 | 03410071 | 0.491702 | 0.00473401 | 19.2201 | 03410073 | 0.00449312 | 0.491943 | 19.2570 |
| 2 | 03410072 | 0.492940 | 0.00349599 | 19.1926 | 03410074 | 0.00229185 | 0.494144 | 19.2306 |
| 3 | 03410075 | 0.494317 | 0.00211900 | 19.1260 | 03410077 | 0.00310413 | 0.493332 | 19.1308 |