| Red | Green | Blue | |
| z | 17.63 | ||
| znorm | Inf | ||
| sky | -NaN | -NaN | -Inf |
| S/N | 27.5 | 46.7 | 49.7 |
| S/N(c) | 0.0 | 0.0 | 0.0 |
| SN(E/C) |
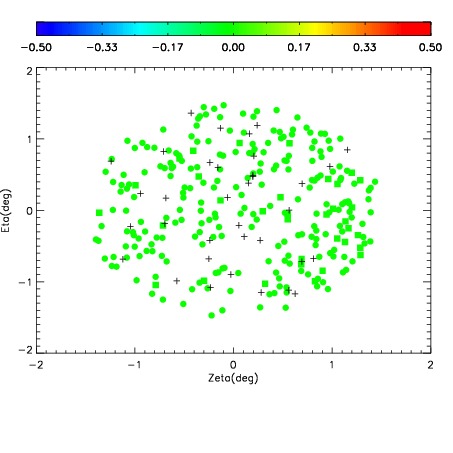
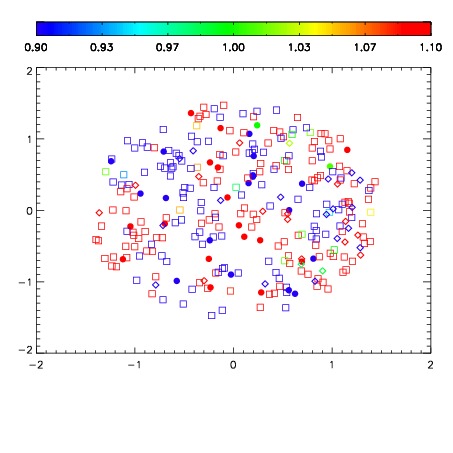
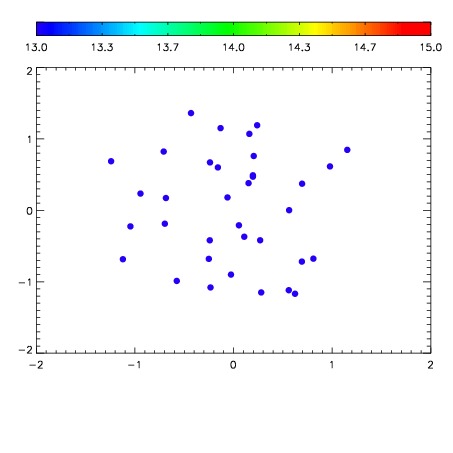

| Frame | Nreads | Zeropoints | Mag plots | Spatial mag deviation | Spatial sky 16325A emission deviations (filled: sky, open: star) | Spatial sky continuum emission | Spatial sky telluric CO2 absorption deviations (filled: H < 10) | |||||||||||||||||||||||
| 0 | 0 |
|
|
|
|
|
|
| IPAIR | NAME | SHIFT | NEWSHIFT | S/N | NAME | SHIFT | NEWSHIFT | S/N |
| 0 | 04290010 | 0.498191 | 0.00000 | 18.8209 | 04290008 | 0.00000 | 0.498191 | 18.7689 |
| 1 | 04290013 | 0.494868 | 0.00332299 | 18.9902 | 04290012 | 5.33984e-05 | 0.498138 | 18.9372 |
| 2 | 04290014 | 0.495792 | 0.00239900 | 18.9746 | 04290015 | 0.00158656 | 0.496604 | 18.9220 |
| 3 | 04290009 | 0.495052 | 0.00313899 | 18.8393 | 04290011 | 0.000607461 | 0.497584 | 18.8653 |