| Red | Green | Blue | |
| z | 17.63 | ||
| znorm | Inf | ||
| sky | -NaN | -NaN | -NaN |
| S/N | 32.6 | 54.3 | 57.6 |
| S/N(c) | 0.0 | 0.0 | 0.0 |
| SN(E/C) |
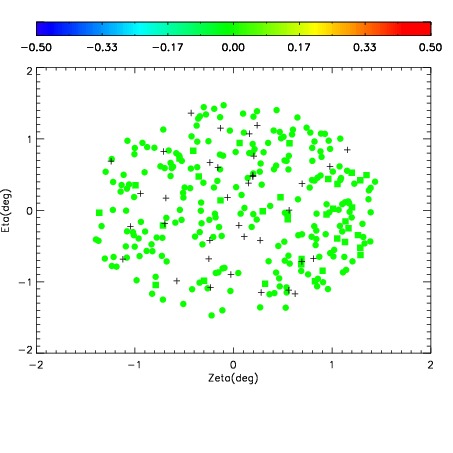
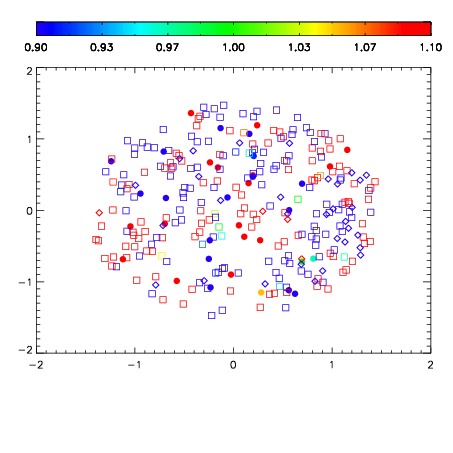
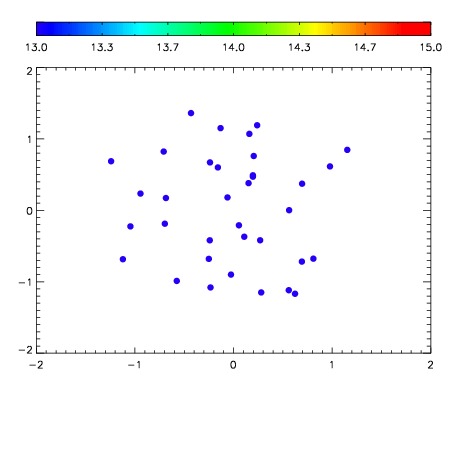

| Frame | Nreads | Zeropoints | Mag plots | Spatial mag deviation | Spatial sky 16325A emission deviations (filled: sky, open: star) | Spatial sky continuum emission | Spatial sky telluric CO2 absorption deviations (filled: H < 10) | |||||||||||||||||||||||
| 0 | 0 |
|
|
|
|
|
|
| IPAIR | NAME | SHIFT | NEWSHIFT | S/N | NAME | SHIFT | NEWSHIFT | S/N |
| 0 | 06280017 | 0.483086 | 0.00000 | 19.1336 | 06280015 | -0.00149596 | 0.484582 | 19.1042 |
| 1 | 06280013 | 0.479961 | 0.00312498 | 19.1412 | 06280019 | 0.00923726 | 0.473849 | 19.1569 |
| 2 | 06280018 | 0.482980 | 0.000105977 | 19.1338 | 06280016 | -0.00292038 | 0.486006 | 19.1201 |
| 3 | 06280014 | 0.479511 | 0.00357500 | 19.1282 | 06280012 | 0.00000 | 0.483086 | 19.0996 |