| Red | Green | Blue | |
| z | 17.64 | ||
| znorm | Inf | ||
| sky | -Inf | -Inf | -Inf |
| S/N | 27.8 | 48.2 | 52.1 |
| S/N(c) | 0.0 | 0.0 | 0.0 |
| SN(E/C) |
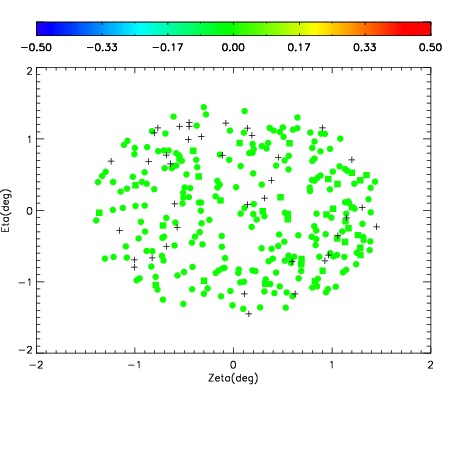
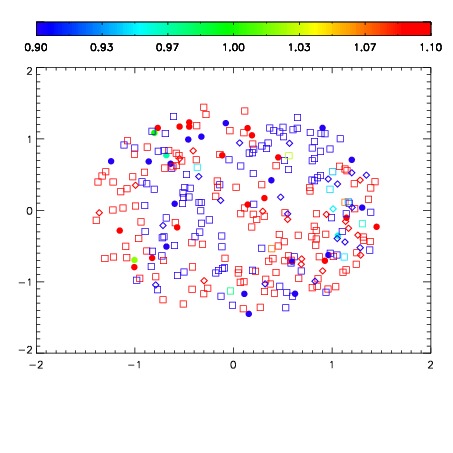
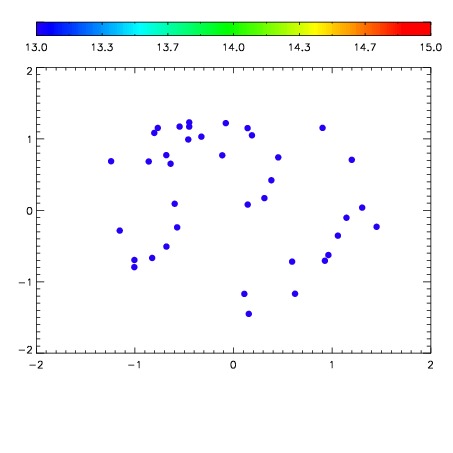

| Frame | Nreads | Zeropoints | Mag plots | Spatial mag deviation | Spatial sky 16325A emission deviations (filled: sky, open: star) | Spatial sky continuum emission | Spatial sky telluric CO2 absorption deviations (filled: H < 10) | |||||||||||||||||||||||
| 0 | 0 |
|
|
|
|
|
|
| IPAIR | NAME | SHIFT | NEWSHIFT | S/N | NAME | SHIFT | NEWSHIFT | S/N |
| 0 | 06700065 | 0.484158 | 0.00000 | 19.1283 | 06700063 | 0.00000 | 0.484158 | 19.1342 |
| 1 | 06700069 | 0.477663 | 0.00649500 | 19.1370 | 06700070 | 0.00262370 | 0.481534 | 19.1746 |
| 2 | 06700068 | 0.476984 | 0.00717402 | 19.1308 | 06700067 | -0.000460944 | 0.484619 | 19.1589 |
| 3 | 06700064 | 0.483422 | 0.000735998 | 19.1120 | 06700066 | -0.000231295 | 0.484389 | 19.1190 |