| Red | Green | Blue | |
| z | 17.64 | ||
| znorm | Inf | ||
| sky | -Inf | -Inf | -Inf |
| S/N | 29.2 | 51.0 | 53.3 |
| S/N(c) | 0.0 | 0.0 | 0.0 |
| SN(E/C) |


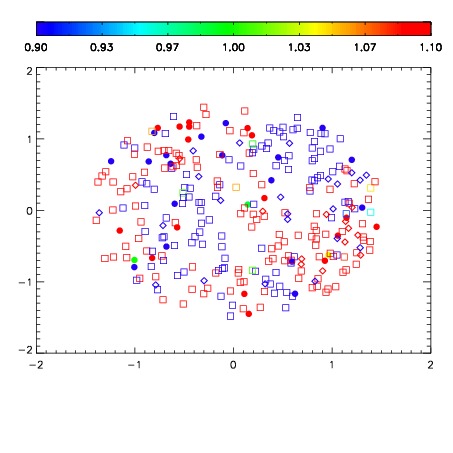


| Frame | Nreads | Zeropoints | Mag plots | Spatial mag deviation | Spatial sky 16325A emission deviations (filled: sky, open: star) | Spatial sky continuum emission | Spatial sky telluric CO2 absorption deviations (filled: H < 10) | |||||||||||||||||||||||
| 0 | 0 |
|
|
|
|
|
|
| IPAIR | NAME | SHIFT | NEWSHIFT | S/N | NAME | SHIFT | NEWSHIFT | S/N |
| 0 | 06760012 | 0.493070 | 0.00000 | 19.2034 | 06760014 | 0.00246800 | 0.490602 | 19.2169 |
| 1 | 06760016 | 0.492010 | 0.00106001 | 19.2099 | 06760013 | 0.00227689 | 0.490793 | 19.2311 |
| 2 | 06760015 | 0.491370 | 0.00170001 | 19.2010 | 06760017 | 0.00439439 | 0.488676 | 19.2063 |
| 3 | 06760011 | 0.492797 | 0.000273019 | 19.1824 | 06760010 | 0.00000 | 0.493070 | 19.1468 |