| Red | Green | Blue | |
| z | 17.64 | ||
| znorm | Inf | ||
| sky | -Inf | -Inf | -Inf |
| S/N | 24.9 | 42.7 | 45.6 |
| S/N(c) | 0.0 | 0.0 | 0.0 |
| SN(E/C) |
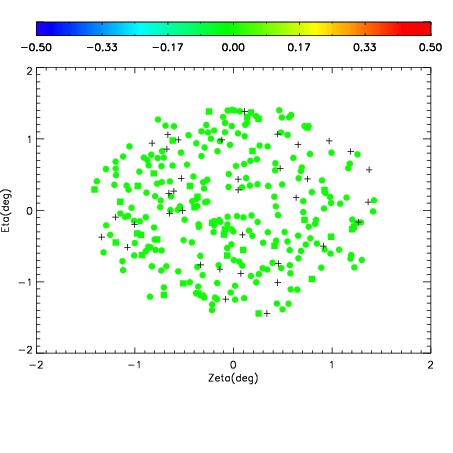
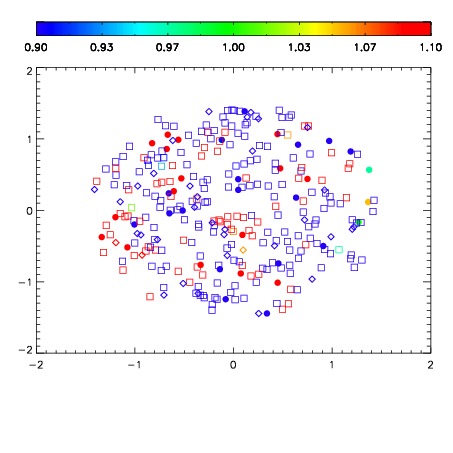
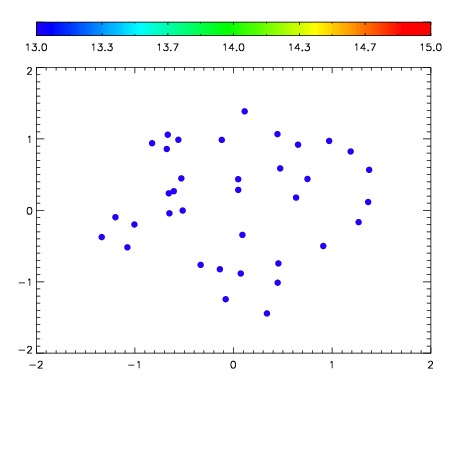

| Frame | Nreads | Zeropoints | Mag plots | Spatial mag deviation | Spatial sky 16325A emission deviations (filled: sky, open: star) | Spatial sky continuum emission | Spatial sky telluric CO2 absorption deviations (filled: H < 10) | |||||||||||||||||||||||
| 0 | 0 |
|
|
|
|
|
|
| IPAIR | NAME | SHIFT | NEWSHIFT | S/N | NAME | SHIFT | NEWSHIFT | S/N |
| 0 | 02870092 | 0.414018 | 0.00000 | 19.1227 | 02870093 | -0.000501488 | 0.414519 | 19.0122 |
| 1 | 02870091 | 0.412911 | 0.00110701 | 19.0774 | 02870090 | -0.000719871 | 0.414738 | 18.9771 |
| 2 | 02870088 | 0.412808 | 0.00121000 | 19.0393 | 02870086 | 0.00000 | 0.414018 | 18.8548 |
| 3 | 02870087 | 0.412107 | 0.00191101 | 18.9321 | 02870089 | 0.000918594 | 0.413099 | 18.8424 |