| Red | Green | Blue | |
| z | 17.64 | ||
| znorm | Inf | ||
| sky | -Inf | -Inf | -Inf |
| S/N | 17.7 | 31.7 | 33.4 |
| S/N(c) | 0.0 | 0.0 | 0.0 |
| SN(E/C) |
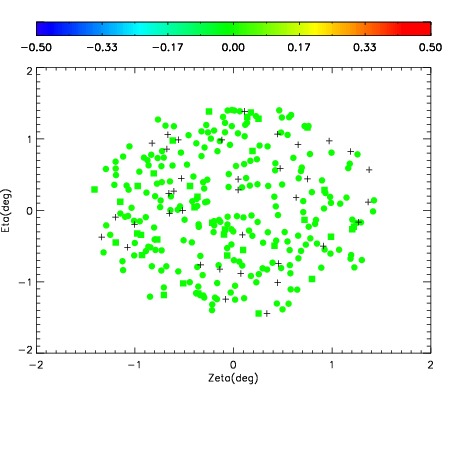
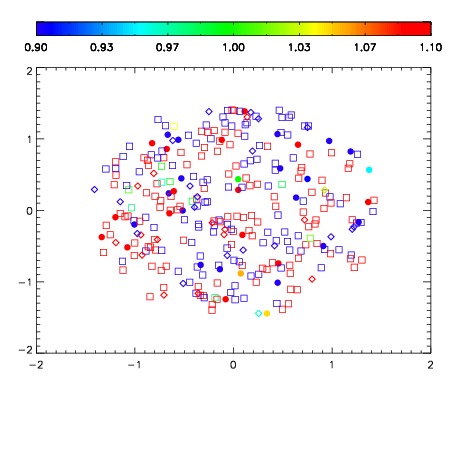
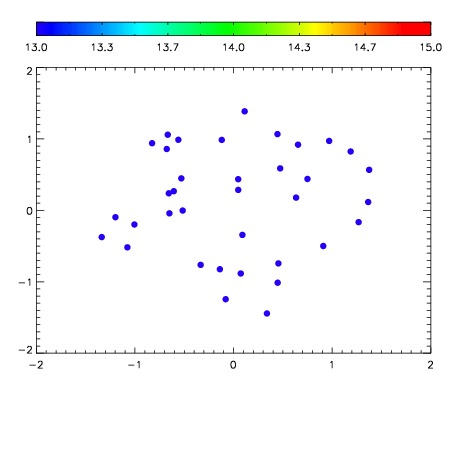

| Frame | Nreads | Zeropoints | Mag plots | Spatial mag deviation | Spatial sky 16325A emission deviations (filled: sky, open: star) | Spatial sky continuum emission | Spatial sky telluric CO2 absorption deviations (filled: H < 10) | |||||||||||||||||||||||
| 0 | 0 |
|
|
|
|
|
|
| IPAIR | NAME | SHIFT | NEWSHIFT | S/N | NAME | SHIFT | NEWSHIFT | S/N |
| 0 | 03650049 | 0.509742 | 0.00000 | 18.2815 | 03650050 | 0.00214480 | 0.507597 | 18.1559 |
| 1 | 03650052 | 0.505163 | 0.00457901 | 18.8384 | 03650047 | 0.00000 | 0.509742 | 18.4713 |
| 2 | 03650053 | 0.507764 | 0.00197804 | 18.7111 | 03650054 | 0.00329345 | 0.506449 | 18.2481 |
| 3 | 03650048 | 0.507073 | 0.00266904 | 18.3726 | 03650051 | 0.00154581 | 0.508196 | 18.2181 |