| Red | Green | Blue | |
| z | 17.64 | ||
| znorm | Inf | ||
| sky | -NaN | -NaN | -Inf |
| S/N | 29.0 | 46.9 | 50.9 |
| S/N(c) | 0.0 | 0.0 | 0.0 |
| SN(E/C) |
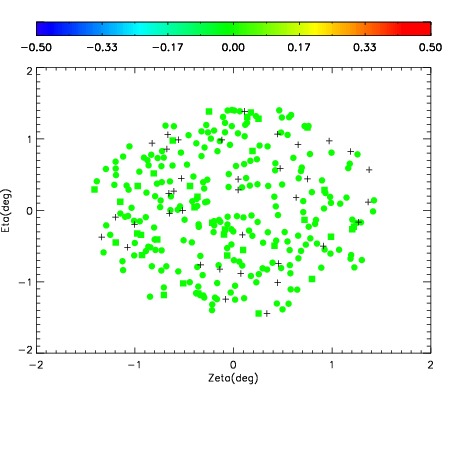
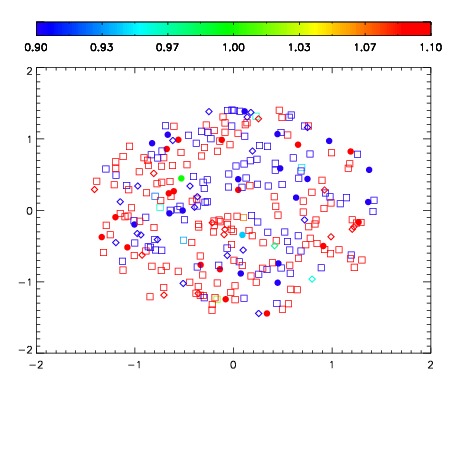
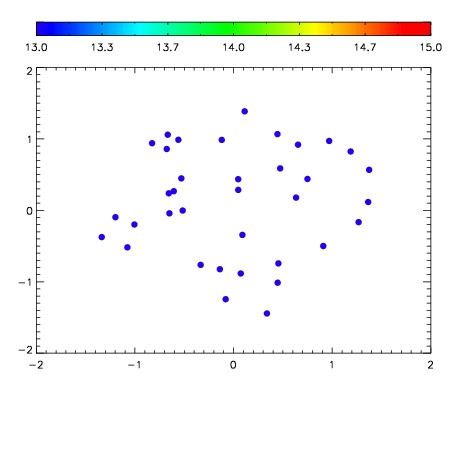

| Frame | Nreads | Zeropoints | Mag plots | Spatial mag deviation | Spatial sky 16325A emission deviations (filled: sky, open: star) | Spatial sky continuum emission | Spatial sky telluric CO2 absorption deviations (filled: H < 10) | |||||||||||||||||||||||
| 0 | 0 |
|
|
|
|
|
|
| IPAIR | NAME | SHIFT | NEWSHIFT | S/N | NAME | SHIFT | NEWSHIFT | S/N |
| 0 | 03710046 | 0.504756 | 0.00000 | 19.1926 | 03710044 | 0.000519101 | 0.504237 | 19.1900 |
| 1 | 03710042 | 0.500050 | 0.00470597 | 19.2165 | 03710047 | 0.00226171 | 0.502494 | 19.1996 |
| 2 | 03710045 | 0.502336 | 0.00241995 | 19.1946 | 03710043 | 0.00107243 | 0.503684 | 19.1994 |
| 3 | 03710041 | 0.497914 | 0.00684199 | 19.1707 | 03710040 | 0.00000 | 0.504756 | 19.1231 |