| Red | Green | Blue | |
| z | 17.64 | ||
| znorm | Inf | ||
| sky | -Inf | -Inf | -Inf |
| S/N | 27.4 | 47.5 | 49.7 |
| S/N(c) | 0.0 | 0.0 | 0.0 |
| SN(E/C) |
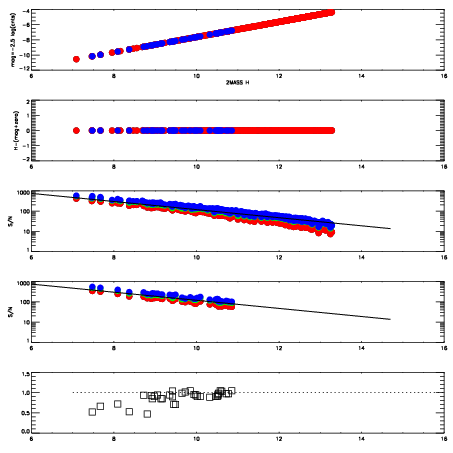
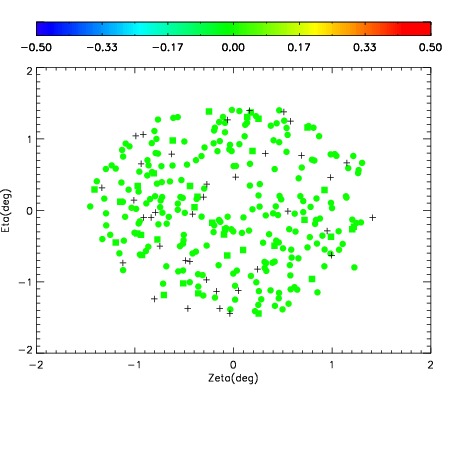
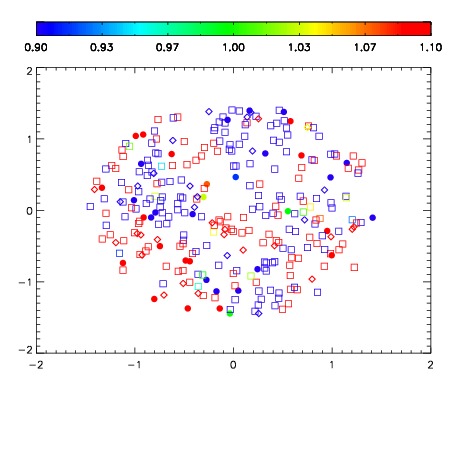
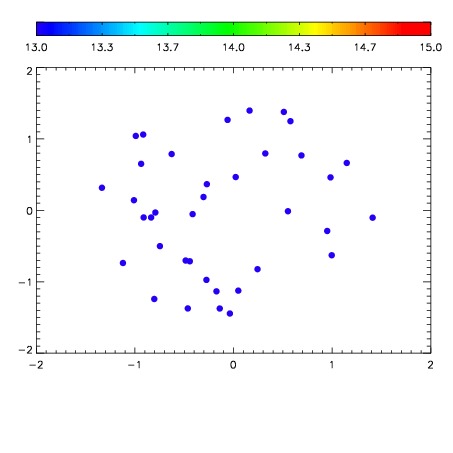

| Frame | Nreads | Zeropoints | Mag plots | Spatial mag deviation | Spatial sky 16325A emission deviations (filled: sky, open: star) | Spatial sky continuum emission | Spatial sky telluric CO2 absorption deviations (filled: H < 10) | |||||||||||||||||||||||
| 0 | 0 |
|
|
|
|
|
|
| IPAIR | NAME | SHIFT | NEWSHIFT | S/N | NAME | SHIFT | NEWSHIFT | S/N |
| 0 | 02860092 | 0.411835 | 0.00000 | 19.0547 | 02860093 | 1.64649e-05 | 0.411819 | 19.0213 |
| 1 | 02860087 | 0.408436 | 0.00339901 | 19.1426 | 02860086 | 0.00000 | 0.411835 | 19.1360 |
| 2 | 02860088 | 0.409585 | 0.00225002 | 19.1195 | 02860089 | 0.000526887 | 0.411308 | 19.1103 |
| 3 | 02860091 | 0.410396 | 0.00143901 | 19.0586 | 02860090 | -0.00111569 | 0.412951 | 19.0819 |