| Red | Green | Blue | |
| z | 17.64 | ||
| znorm | Inf | ||
| sky | -Inf | -Inf | -Inf |
| S/N | 30.7 | 55.2 | 57.8 |
| S/N(c) | 0.0 | 0.0 | 0.0 |
| SN(E/C) |
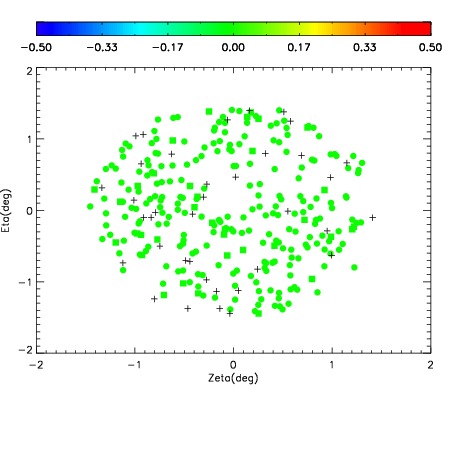
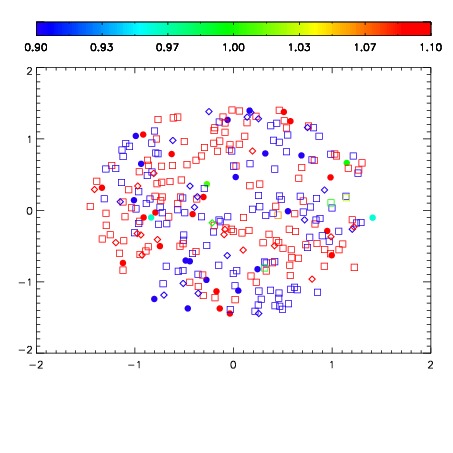
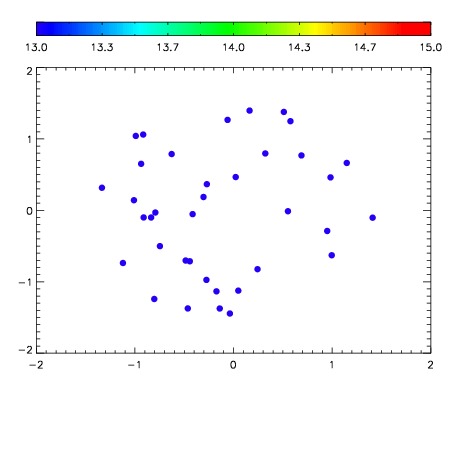

| Frame | Nreads | Zeropoints | Mag plots | Spatial mag deviation | Spatial sky 16325A emission deviations (filled: sky, open: star) | Spatial sky continuum emission | Spatial sky telluric CO2 absorption deviations (filled: H < 10) | |||||||||||||||||||||||
| 0 | 0 |
|
|
|
|
|
|
| IPAIR | NAME | SHIFT | NEWSHIFT | S/N | NAME | SHIFT | NEWSHIFT | S/N |
| 0 | 03660045 | 0.499883 | 0.00000 | 19.1001 | 03660046 | -2.52955e-05 | 0.499908 | 19.0996 |
| 1 | 03660040 | 0.496277 | 0.00360599 | 19.0799 | 03660039 | -4.01635e-05 | 0.499923 | 19.0328 |
| 2 | 03660044 | 0.496636 | 0.00324699 | 18.9953 | 03660043 | -0.00182446 | 0.501707 | 18.9856 |
| 3 | 03660041 | 0.498405 | 0.00147799 | 18.9422 | 03660042 | -1.61352e-05 | 0.499899 | 18.8507 |
| 4 | 03660037 | 0.499053 | 0.000829995 | 18.7215 | 03660038 | 0.00109607 | 0.498787 | 18.8319 |
| 5 | 03660036 | 0.496543 | 0.00334001 | 18.4630 | 03660035 | 0.00000 | 0.499883 | 18.3263 |