| Red | Green | Blue | |
| z | 17.64 | ||
| znorm | Inf | ||
| sky | -Inf | -Inf | -Inf |
| S/N | 22.1 | 39.6 | 41.6 |
| S/N(c) | 0.0 | 0.0 | 0.0 |
| SN(E/C) |
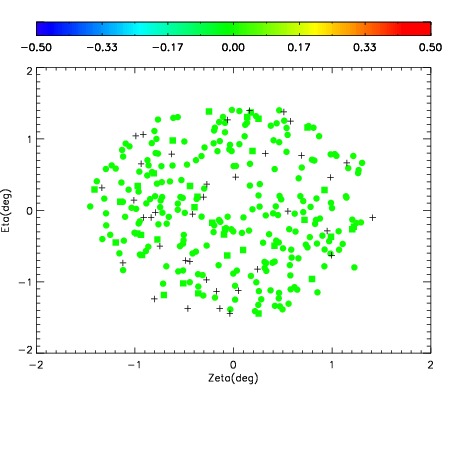
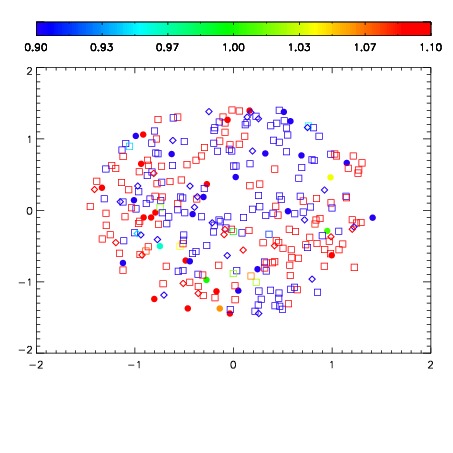
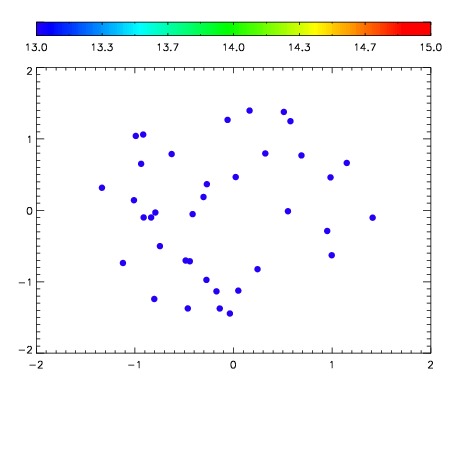

| Frame | Nreads | Zeropoints | Mag plots | Spatial mag deviation | Spatial sky 16325A emission deviations (filled: sky, open: star) | Spatial sky continuum emission | Spatial sky telluric CO2 absorption deviations (filled: H < 10) | |||||||||||||||||||||||
| 0 | 0 |
|
|
|
|
|
|
| IPAIR | NAME | SHIFT | NEWSHIFT | S/N | NAME | SHIFT | NEWSHIFT | S/N |
| 0 | 04050038 | 0.499371 | 0.00000 | 18.7283 | 04050039 | 0.00179473 | 0.497576 | 18.6196 |
| 1 | 04050037 | 0.498056 | 0.00131500 | 18.8928 | 04050043 | 0.00296951 | 0.496401 | 18.8629 |
| 2 | 04050041 | 0.496312 | 0.00305900 | 18.8782 | 04050036 | 0.00000 | 0.499371 | 18.8353 |
| 3 | 04050042 | 0.498950 | 0.000420988 | 18.7805 | 04050040 | 0.00108048 | 0.498291 | 18.6996 |