| Red | Green | Blue | |
| z | 17.64 | ||
| znorm | Inf | ||
| sky | -Inf | -Inf | -Inf |
| S/N | 30.5 | 54.0 | 58.5 |
| S/N(c) | 0.0 | 0.0 | 0.0 |
| SN(E/C) |
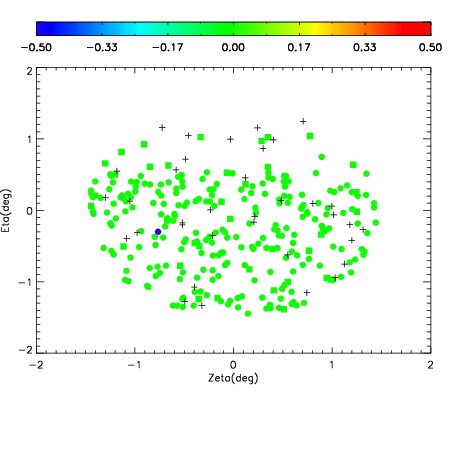
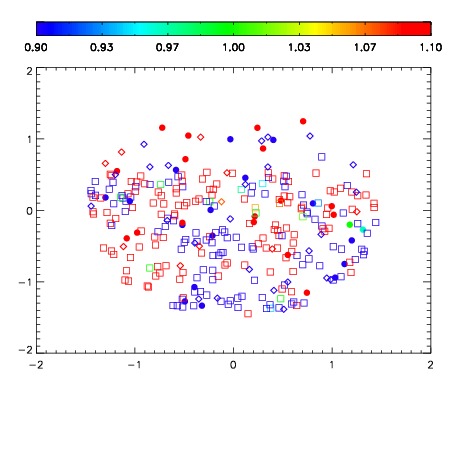


| Frame | Nreads | Zeropoints | Mag plots | Spatial mag deviation | Spatial sky 16325A emission deviations (filled: sky, open: star) | Spatial sky continuum emission | Spatial sky telluric CO2 absorption deviations (filled: H < 10) | |||||||||||||||||||||||
| 0 | 0 |
|
|
|
|
|
|
| IPAIR | NAME | SHIFT | NEWSHIFT | S/N | NAME | SHIFT | NEWSHIFT | S/N |
| 0 | 03130020 | 0.505246 | 0.00000 | 18.9011 | 03130013 | -0.00220010 | 0.507446 | 18.6626 |
| 1 | 03130015 | 0.503784 | 0.00146198 | 18.9724 | 03130021 | -0.000694330 | 0.505940 | 18.9519 |
| 2 | 03130011 | 0.502384 | 0.00286198 | 18.9436 | 03130010 | 0.00000 | 0.505246 | 18.9366 |
| 3 | 03130016 | 0.504485 | 0.000760972 | 18.9215 | 03130018 | -0.00145023 | 0.506696 | 18.8869 |
| 4 | 03130012 | 0.503396 | 0.00185001 | 18.9215 | 03130017 | -0.000986893 | 0.506233 | 18.8614 |
| 5 | 03130019 | 0.503826 | 0.00141996 | 18.7980 | 03130014 | -0.00202018 | 0.507266 | 18.6486 |