| Red | Green | Blue | |
| z | 17.64 | ||
| znorm | Inf | ||
| sky | -Inf | -NaN | -Inf |
| S/N | 29.9 | 52.3 | 57.2 |
| S/N(c) | 0.0 | 0.0 | 0.0 |
| SN(E/C) |

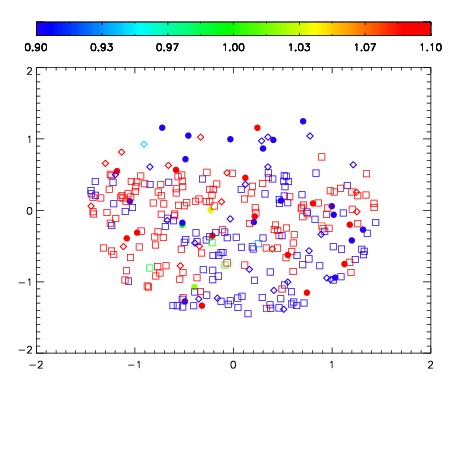
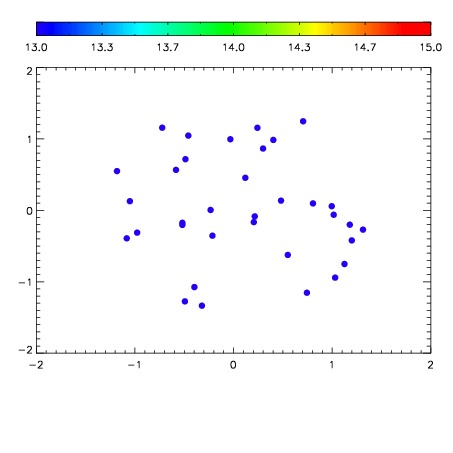

| Frame | Nreads | Zeropoints | Mag plots | Spatial mag deviation | Spatial sky 16325A emission deviations (filled: sky, open: star) | Spatial sky continuum emission | Spatial sky telluric CO2 absorption deviations (filled: H < 10) | |||||||||||||||||||||||
| 0 | 0 |
|
|
|
|
|
|
| IPAIR | NAME | SHIFT | NEWSHIFT | S/N | NAME | SHIFT | NEWSHIFT | S/N |
| 0 | 03680051 | 0.499459 | 0.00000 | 19.0635 | 03680052 | 0.00220673 | 0.497252 | 19.0707 |
| 1 | 03680055 | 0.497766 | 0.00169301 | 19.1779 | 03680053 | 0.000953176 | 0.498506 | 19.1327 |
| 2 | 03680054 | 0.497064 | 0.00239500 | 19.1715 | 03680056 | 0.00102237 | 0.498437 | 19.1276 |
| 3 | 03680050 | 0.498280 | 0.00117901 | 18.9940 | 03680049 | 0.00228788 | 0.497171 | 18.6661 |
| 4 | 03680047 | 0.498881 | 0.000577986 | 18.7189 | 03680048 | 0.00196133 | 0.497498 | 18.5603 |
| 5 | 03680046 | 0.498833 | 0.000625998 | 17.9913 | 03680045 | 0.00000 | 0.499459 | 18.2764 |